A reply to Scott Galloway’s “1999.AI”
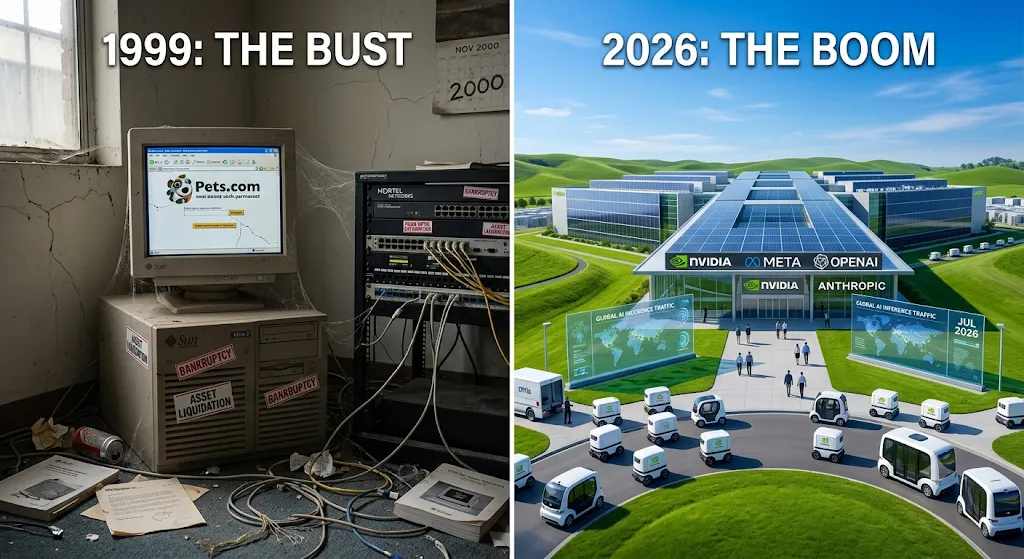
Scott Galloway published a piece on July 17th called “1999.AI,” and it has been gaining traction. The argument is elegant, which is part of the problem. It goes like this: in 1999 the consumer internet companies died first, then the business-to-business layer that served them, then the infrastructure companies that had extended credit to both. Sun Microsystems lost ninety-six percent of its market capitalization. Nortel lost ninety percent in a year. Galloway sees the same dominoes lined up now, with OpenAI’s losses at one end and Nvidia’s valuation at the other, and he sees a market so concentrated that, in his phrase, “when AI sneezes, the U.S. economy’s lungs may begin to fill with fluid.”
He is not a crank. He was in the room in 1999, running a company he freely admits was priced at four times revenues while losing twenty million dollars. Parts of this essay are correct and I will call them out.
But an analogy loses a lot in the comparison due to assumptions and a general poor fit. Hold the specific mechanics of that collapse against the specific mechanics of what is happening now, and most of the parts do not line up. Some point the opposite direction, causing some to argue “are we ready if the bubble doesn’t pop?”
The chart that started the sobriety narrative
The center of gravity in Galloway’s piece is the claim that enterprise buyers are pulling back. He cites Uber blowing through its annual artificial intelligence budget in four months, an anonymous company running up a five-hundred-million-dollar Claude bill in a single month, and a pivot at DoorDash, Meta, Microsoft, and Salesforce from what the industry has been calling “tokenmaxxing” to something more disciplined. The implication is that demand is rolling over.
Underneath that narrative sits a specific chart, and the chart does not say what people think it says.
The Silicon Data LLM Token Expenditure Index went viral in June after Citadel Securities circulated it in a research note. The line goes down. Wall Street read the line going down as a collapse in agentic demand. But Silicon Data itself clarified that the index would have been better named a token expenditure price index. It measures the usage-weighted average price paid for a million tokens, irrespective of which model served them. A downward line means the average price paid drifted back toward where it sat a few weeks earlier. It says nothing whatsoever about total volume, total demand, or total spending.
It gets worse for the bearish reading. The index draws its data exclusively from third-party token routers, companies whose entire commercial purpose is to find cheaper tokens for their customers. It has no visibility into the direct relationships with OpenAI and Anthropic where the overwhelming majority of enterprise token spend actually flows. So the index is structurally biased toward whichever direction cost-seeking behavior is moving. It is a useful leading indicator of what the most sophisticated buyers are doing. It is not a picture of the market.
Nathaniel Whittemore, who hosts The AI Daily Brief, spent most of an episode on June 12th taking the chart apart, and his summary of what it actually shows is the right one: that is “not a bubble popping, that’s a market rationalizing.” Citadel’s own note, read past the screenshot, argues something considerably less dramatic than the headlines suggested. It describes demand bifurcating between frontier and everyday usage, with the most expensive inference concentrating among the firms best positioned to use it.
Then there is the number that should end the sobriety story on its own. According to Ramp’s spending data, the median company spends eleven dollars and thirty-eight cents per employee per month on artificial intelligence. Not eleven hundred. Eleven dollars and thirty-eight cents. The top ten percent of firms spend six hundred and ten.
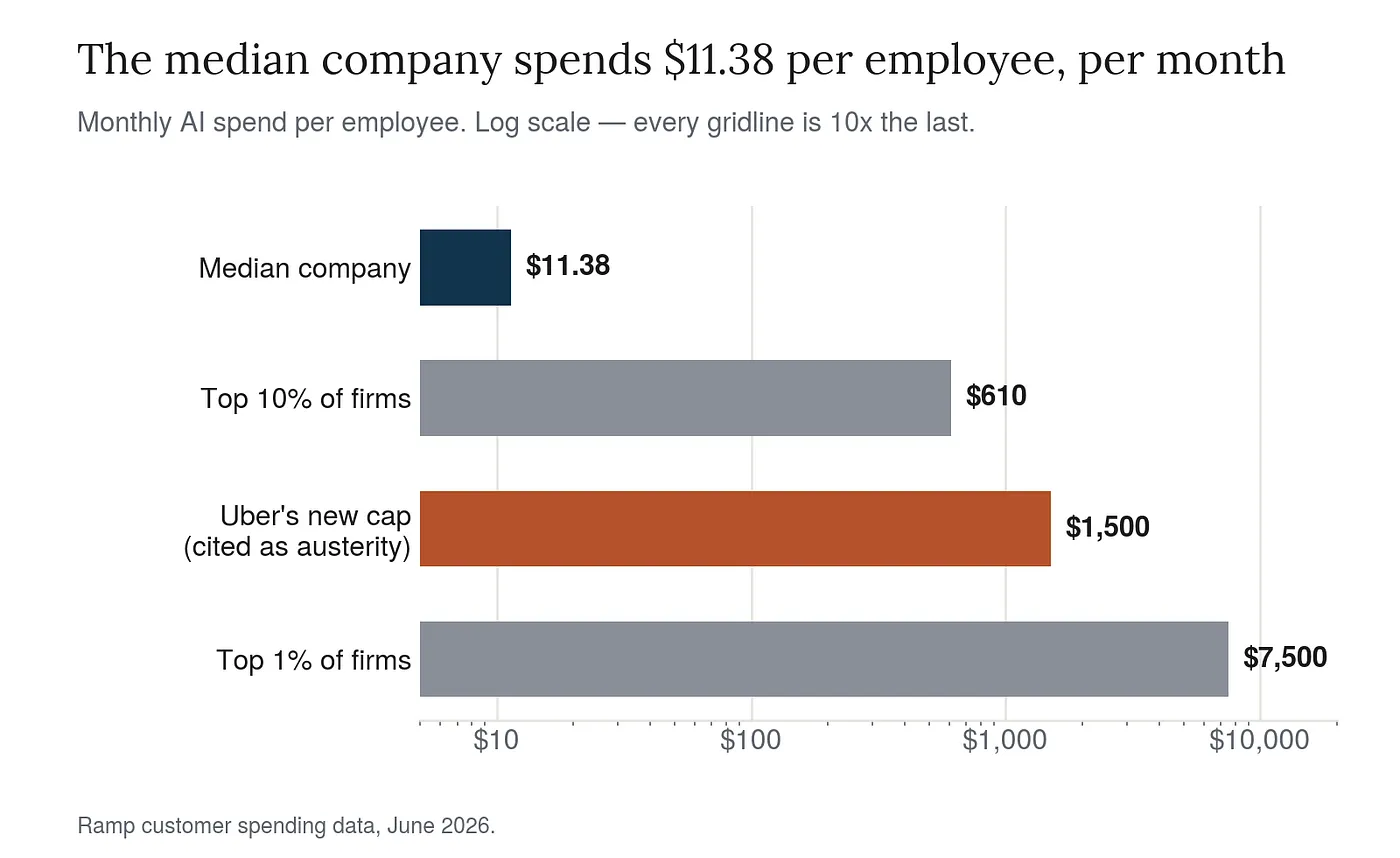
The top one percent, the fully committed, spend about seventy-five hundred.
Every spending cap in the news comes from that top sliver. Uber’s cap, the one being cited as evidence of retrenchment, is fifteen hundred dollars per employee per month. That is more than a hundred times the median. If the entire market moved from eleven dollars to Uber’s supposedly austere ceiling, the expansion in total consumption would swamp any revenue lost to efficiency by an order of magnitude that is difficult to overstate.
The five-hundred-million-dollar accident deserves a second look too. Galloway presents it as evidence of waste, which it partly is; reporting indicates some employees were using a frontier model to check the weather. But a single company capable of consuming half a billion dollars of inference in thirty days is also a demand story. In 1999 the equivalent anecdote would have been a company accidentally buying too many Sun servers. Nobody in 1999 had that problem.
What OpenAI’s numbers actually say
Galloway writes that OpenAI lost twenty-one billion dollars in 2025 and that for every dollar subscribers spend on ChatGPT, the company spends nearly three. Both figures are accurate, so lets take a closer look.
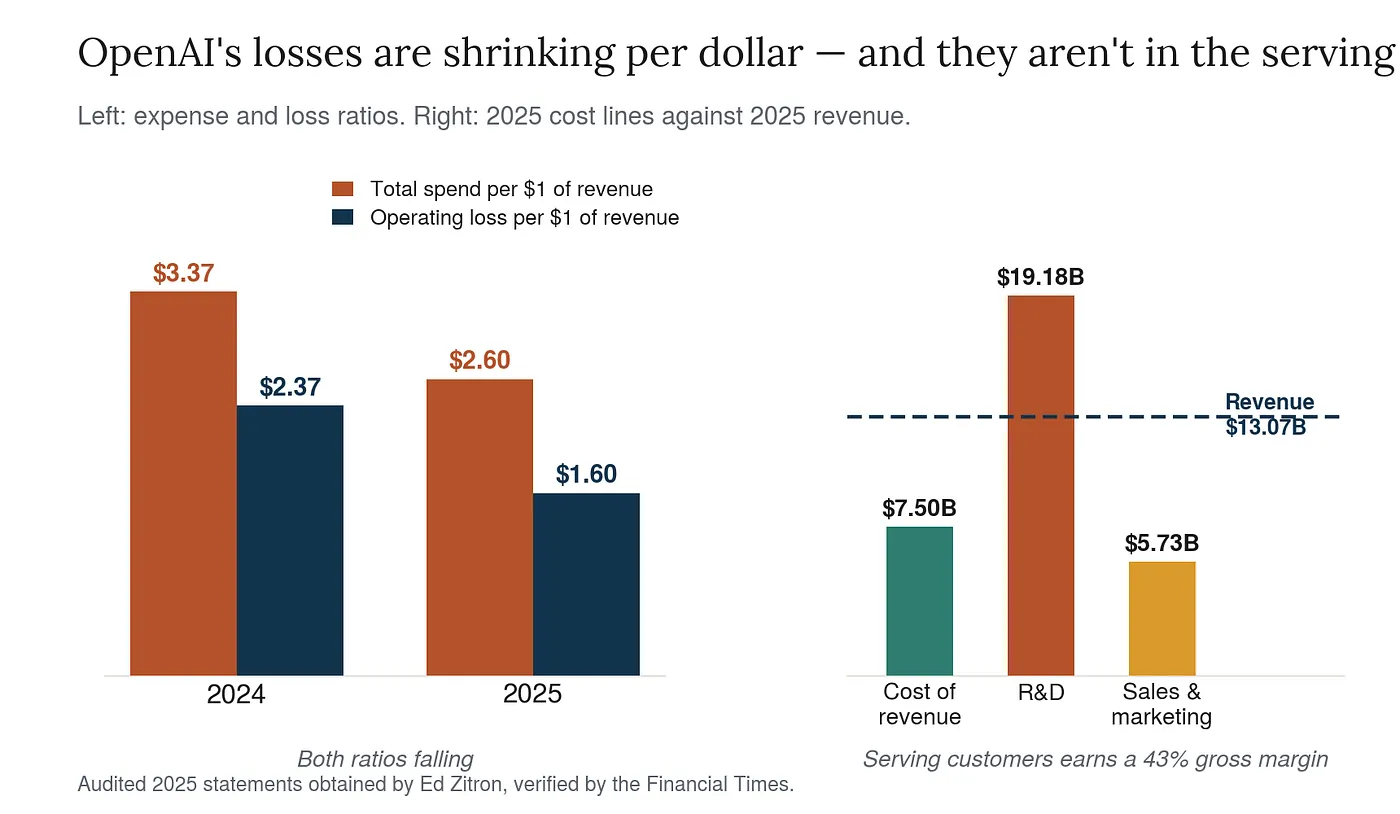
The audited statements Ed Zitron obtained in June, independently verified by the Financial Times, show 2025 revenue of thirteen point zero seven billion dollars against thirty-four billion in total costs. That is an operating loss of twenty point nine three billion, and it works out to two dollars and sixty cents of spending per dollar of revenue. The widely reported thirty-eight point five billion net loss is a different animal; roughly forty-one billion of charges flowed from the company’s conversion out of nonprofit status, a non-cash accounting event that will not recur.
The argument is not that the ratio is wrong. It is that a ratio is a snapshot and the direction is the information. In 2024, OpenAI spent three dollars and thirty-seven cents per dollar of revenue and lost two dollars and thirty-seven cents. In 2025 it spent two dollars and sixty cents and lost one dollar and sixty cents, while tripling its top line. A company narrowing its loss per revenue dollar by roughly a third in a year, during the most expensive phase of its buildout, is not describing the same curve Pets.com was on.
Composition matters here. Cost of revenue, the line that captures actually serving model outputs to paying users, was seven and a half billion dollars against thirteen point zero seven billion in revenue. That is a gross margin of about forty-three percent, up from roughly twenty-eight percent the year before. Serving customers makes money and is getting better at it. The deficit lives in research and development, which came to nineteen point one eight billion dollars, and in sales and marketing, which came to five point seven three billion.
This matters because Galloway’s Sun and Nortel analogy depends on the losses being unit-economic. Sun’s problem was that its customers stopped existing. Nortel’s problem was that it had lent money to customers who then went bankrupt and could not pay. Neither company had a healthy core business hiding underneath an investment program. OpenAI’s research spending is closer to what a semiconductor company spends designing a new process node, or what a pharmaceutical company spends on a drug pipeline. You can argue it is too much. You cannot argue it is the same thing as selling below cost to customers who are about to vanish.
Skeptics will note, fairly, that some inference costs appear to sit inside that research line rather than in cost of revenue, which muddies the margin picture. That is a real caveat. It is also a very different debate than the one Galloway is having.
Who is actually paying for the buildout
The strongest version of the pro-boom argument used to be simple: this infrastructure is being funded by the most profitable balance sheets in corporate history, not by vendor financing extended to insolvent startups. That argument is still mostly right, but it is weaker than it was six months ago, so it’s important to state clearly.
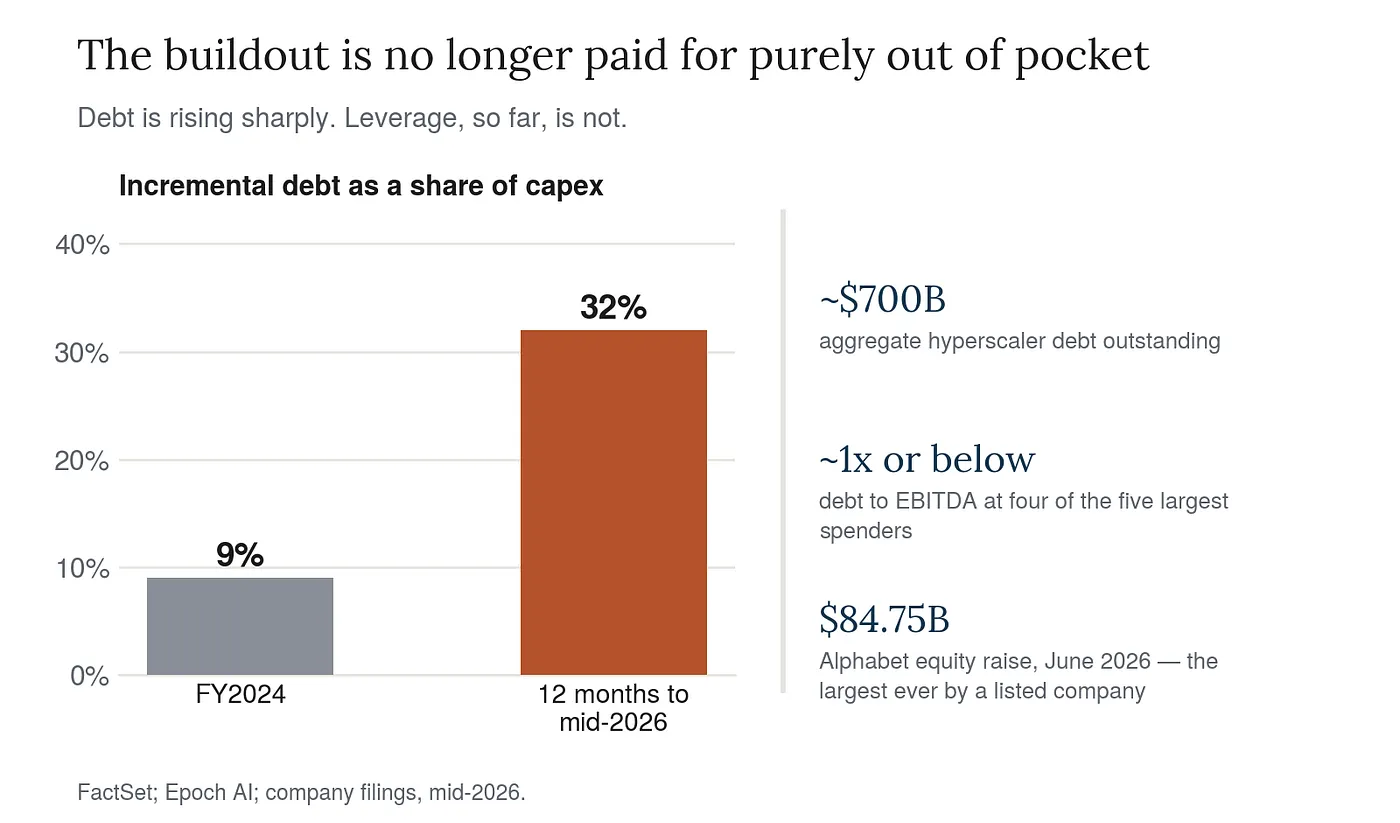
The numbers have moved. Incremental annual debt rose from nine percent of hyperscaler capital expenditure in fiscal 2024 to thirty-two percent in the twelve months ending mid-2026, taking aggregate total debt to roughly seven hundred billion dollars. Alphabet priced an eighty-four point seven five billion dollar equity raise in June, the largest equity transaction ever completed by a listed corporation. Amazon placed a twenty-five billion dollar bond. Epoch AI’s modeling has aggregate hyperscaler capital expenditure crossing above operating cash flow around the third quarter of this year, which is to say right about now. Amazon’s free cash flow in a recent quarter fell to one point two billion dollars, down from a figure many times that.
So: this is no longer a boom funded purely out of pocket. Anyone who tells you otherwise has not looked recently.
But the specific failure mode Galloway is warning about is vendor financing, and that is a different thing from bond issuance. Nortel, Lucent, and Global Crossing lent money to dot-com customers so those customers could buy their equipment. When the customers went bankrupt, the receivables evaporated and the revenue turned out to have been circular all along.
Today’s structure inverts that. Nvidia’s largest customer category is hyperscalers, at slightly over half of data center revenue, and those hyperscalers are Microsoft, Alphabet, Amazon, and Meta. They are paying cash, from businesses that generate hundreds of billions of dollars in operating cash flow annually from search advertising, cloud hosting, and enterprise software that has nothing to do with artificial intelligence. Total debt to earnings before interest, taxes, depreciation and amortization remains around one times or below for four of the five largest spenders. The liabilities-to-assets ratio for hyperscalers sits far below the S&P 500 average.
The risk here is real but it is a duration risk, not a solvency risk. If the revenue does not arrive on the schedule the debt assumes, these companies will have to slow down, and the stocks will be punished. That is not the same as the counterparty simply ceasing to exist, which is what happened to Nortel.
Nvidia is not Sun, and the reason is the margin
The comparison people reach for is Sun Microsystems, but the comparison fails for clear reasons.
Sun peaked at roughly ten times revenues and a two-hundred-billion-dollar market capitalization. Scott McNealy’s post-mortem was arithmetic: at ten times revenues, to give an investor a ten-year payback, the company would have to pay out one hundred percent of revenue as dividends for a decade, with no cost of goods sold, no operating expenses, no taxes, and no research spending. For a hardware company with thirty-nine thousand employees and thin margins, that was fantasy.
Nvidia closed fiscal 2026 with two hundred fifteen point nine billion dollars in revenue, up sixty-five percent, at gross margins of seventy-one percent for the year and seventy-five percent in the fourth quarter. In the first quarter of fiscal 2027 it reported eighty-one point six billion in revenue and guided the following quarter to ninety-one billion. Its market capitalization is around five trillion dollars.
That is expensive. On trailing revenue it is roughly twenty-three times sales, more than double what McNealy called ridiculous. But McNealy’s point was that the multiple was ridiculous given the margin structure underneath it. Nvidia converts three-quarters of every revenue dollar to gross profit and earned nearly one hundred and twenty billion dollars in fiscal 2026. Against forward revenue the multiple is closer to fifteen. Sun never had a quarter that looked remotely like this.
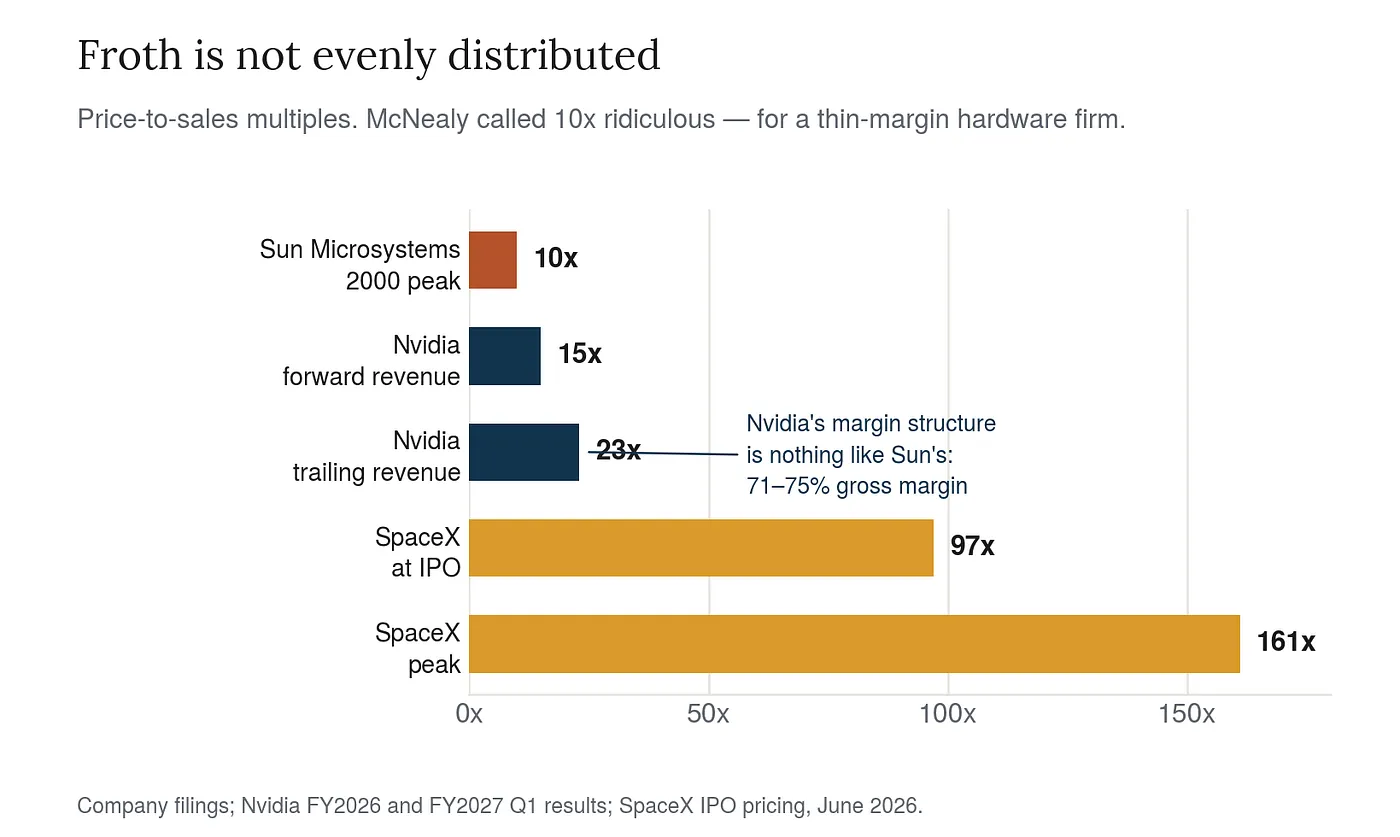
Where Galloway’s instinct lands cleanly is elsewhere in the market. He takes a shot at Goldman Sachs and Morgan Stanley for publishing buy recommendations on SpaceX while serving as lead underwriters on its offering, and he is right to. SpaceX came public at roughly ninety-seven times sales and touched one hundred and sixty-one times sales at its peak. That is not a Nvidia multiple or a Sun multiple. That is something else entirely, and the conflict of interest he identifies is exactly the sort of consensual hallucination that made 1999 what it was. When Goldman simultaneously runs the offering and forecasts four hundred seventy-four billion dollars of 2030 revenue, the appropriate response is the one Galloway gives.
The lesson is not that there is no froth. It is that froth is not uniformly distributed, and treating the whole complex as one undifferentiated bubble is precisely the analytical error that made people sell Amazon in 2001.
Is anyone actually getting value out of this?
Galloway’s implicit answer is not really, or at least not enough to justify the spending. The evidence points the other way, though not overwhelmingly.
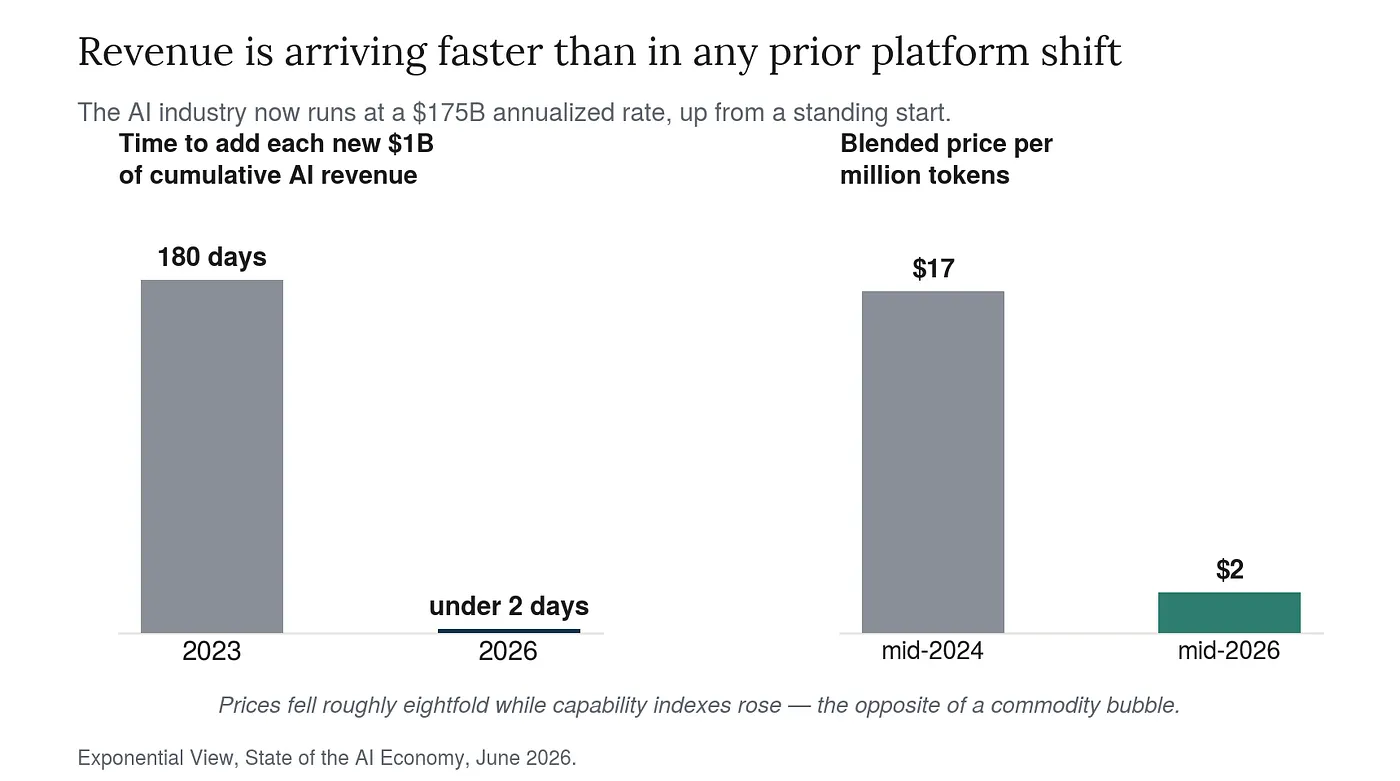
Exponential View audited more than a thousand artificial intelligence companies for its State of the AI Economy report and found one hundred and ten billion dollars of revenue banked over twelve months, at a run rate of one hundred and seventy-five billion. In 2023 the industry needed a hundred and eighty days to add a billion dollars of cumulative revenue. It now adds one billion dollars roughly every two days. Blended token prices fell from seventeen dollars per million to two dollars between mid-2024 and mid-2026 while capability indexes rose, which is the opposite of what a bubble in a commodity looks like.
The demand-side evidence is better than the discourse suggests. Companies in the top quartile of adoption grew revenue more than a hundred percent over three years, against fifteen to twenty percent for companies with no adoption at all. A third of public companies now discuss artificial intelligence impact on earnings calls, up from about ten percent in early 2023. KPMG’s quarterly survey, notable because it was collected during the agentic period rather than before it, found the share of senior leaders reporting meaningful business value climbing from sixty-four to seventy-six percent in a single quarter, and organizations with clear internal accountability for AI decisions three times more likely to report measurable return.
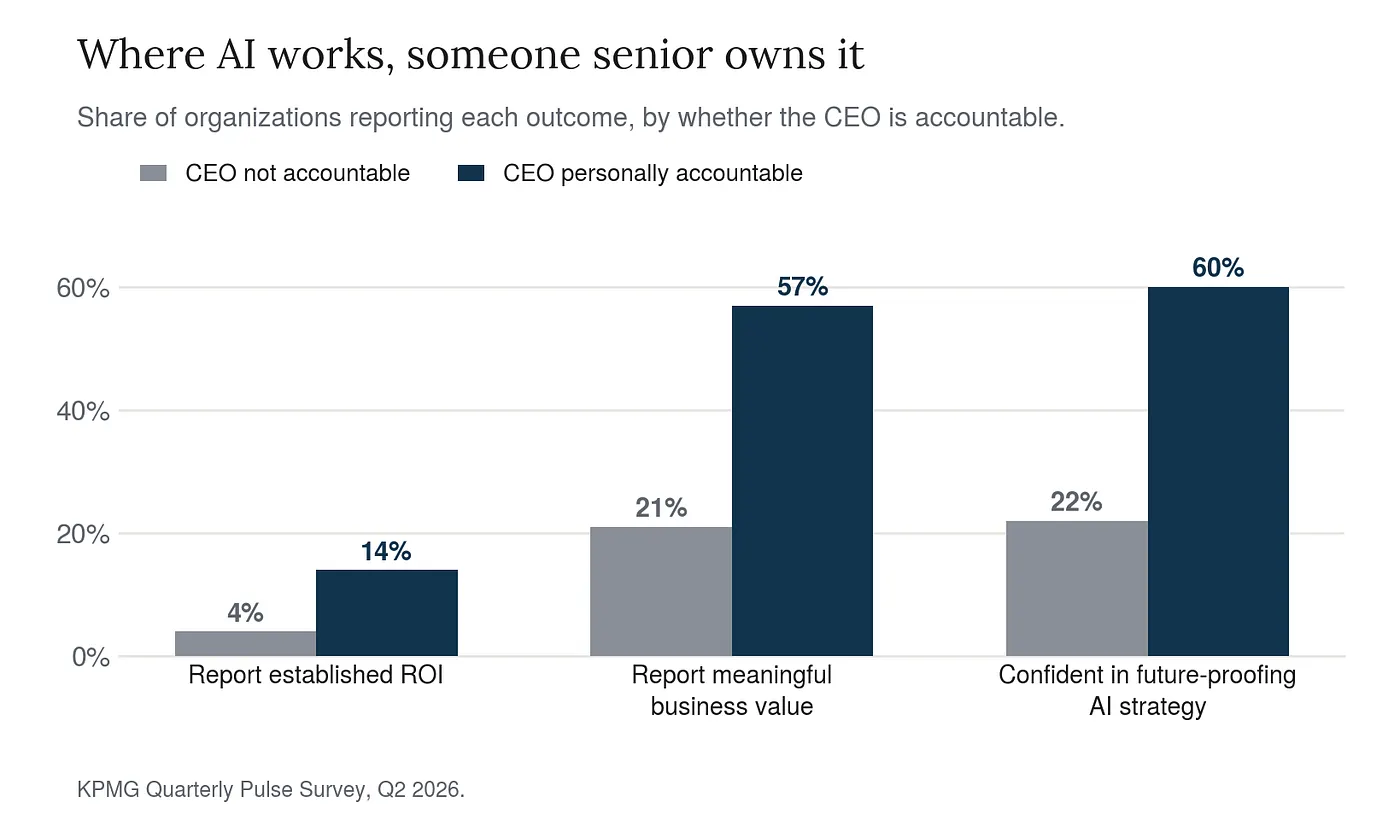
That same survey contains the most honest counterweight: only about a third of organizations have full visibility into their own AI operating costs, and roughly half have rephased a deployment after discovering costs outran expected value. That is not a bubble bursting. That is what every enterprise technology cycle looks like at this stage. When cloud computing arrived, companies overspent spectacularly, got bill shock, hired people whose entire job was cost governance, and then kept migrating. Nobody now describes 2014 as the year the cloud bubble popped.
On the jobs and the data centers
Two fears travel alongside the bubble narrative and deserve separate treatment, because they are what most people actually feel when they hear about all this.
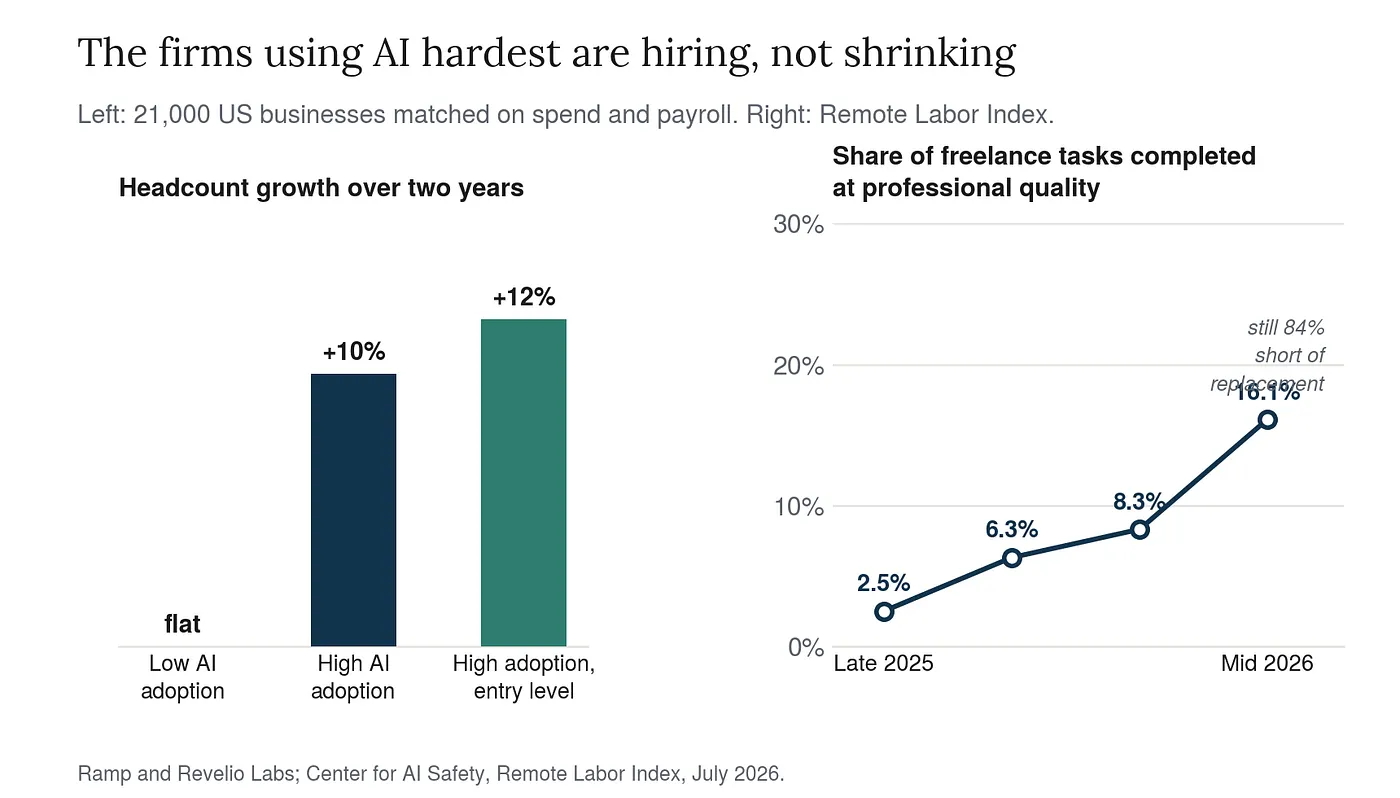
The first is jobs. Ramp and Revelio Labs matched artificial intelligence spending against payroll data for twenty-one thousand American businesses and found that high-adoption firms grew headcount ten percent over two years, with entry-level hiring up twelve percent, while low-adoption firms stayed flat. A Box survey of more than sixteen hundred mid-size and large companies found fifty-eight percent expecting headcount growth over three years, rising to seventy-nine percent among the most mature adopters. Meanwhile the Center for AI Safety’s Remote Labor Index, which grades model output against a paid professional’s work, has the best current model completing about sixteen percent of real freelance tasks at professional quality. That is a remarkable jump from two and a half percent late last year. It is also eighty-four percent short of replacement.
None of which means nothing is happening. Technology and finance are shedding roughly twenty-eight thousand jobs a month this year while the broader economy adds a hundred and thirteen thousand. Specific roles will be hollowed out and specific people, particularly late in their careers, will struggle to pivot. Targeted policy for identifiable at-risk categories is a tractable problem. Nothing here supports a general apocalypse though.
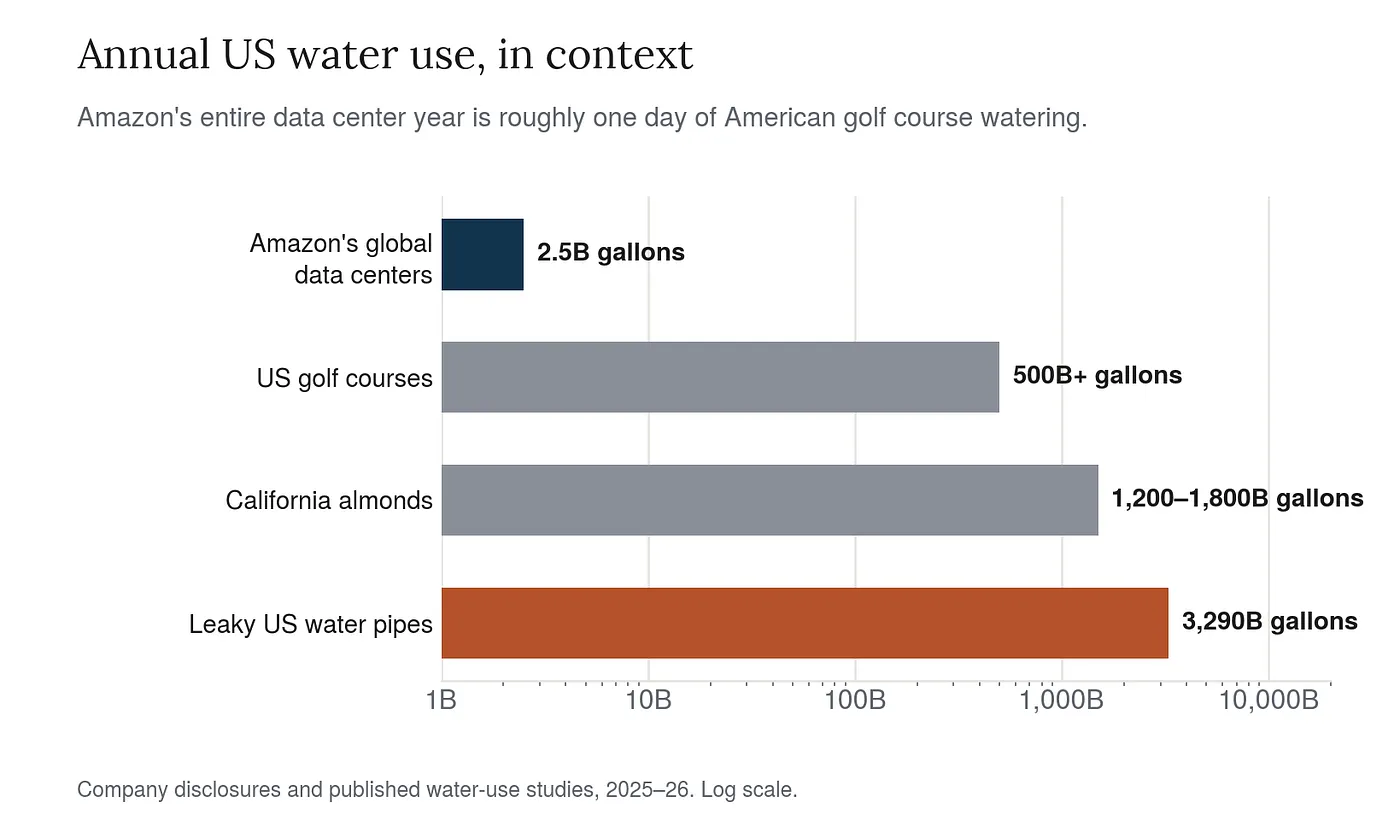
The second fear is data centers, and updating their impact on water and power. Amazon’s entire global data center fleet used two and a half billion gallons of water in 2025, down two percent even as the footprint grew. American golf courses use more than five hundred billion gallons a year, meaning Amazon’s full year is roughly one day of golf course maintenance. Leaky municipal pipes waste about three point two nine trillion gallons annually, roughly fifteen times all data center use combined. California almonds consume five to eight times what all American data centers do.
Electricity is more complicated. The Institute for Energy Research found no significant relationship between a state’s data center concentration and the pace of its rate increases. But a Bloomberg analysis of twenty-five thousand grid nodes found wholesale prices as much as two hundred sixty-seven percent higher than five years earlier near major clusters, with more than seventy percent of the nodes recording increases sitting within fifty miles of significant activity. That figure is worth handling carefully, since it describes wholesale power rather than household bills, and wholesale is only a third to a half of a retail bill. What’s left is still a real problem, and it is a cost-allocation and grid-modernization problem rather than an argument against the facilities themselves. Oregon’s POWER Act requires the largest users to bear the cost of infrastructure built specifically for them, which is the right direction for a wider policy.
There is also a version of this where communities do well. In Richland Parish, Louisiana, hundreds of teachers are receiving fifty-thousand-dollar bonuses funded by the surge in sales tax receipts from a Meta campus. The choice on offer is not roll over or grab pitchforks. It is whether local governments negotiate competently.
Where Galloway is right
Three of his points survive intact, and pretending otherwise would be disingenuous.
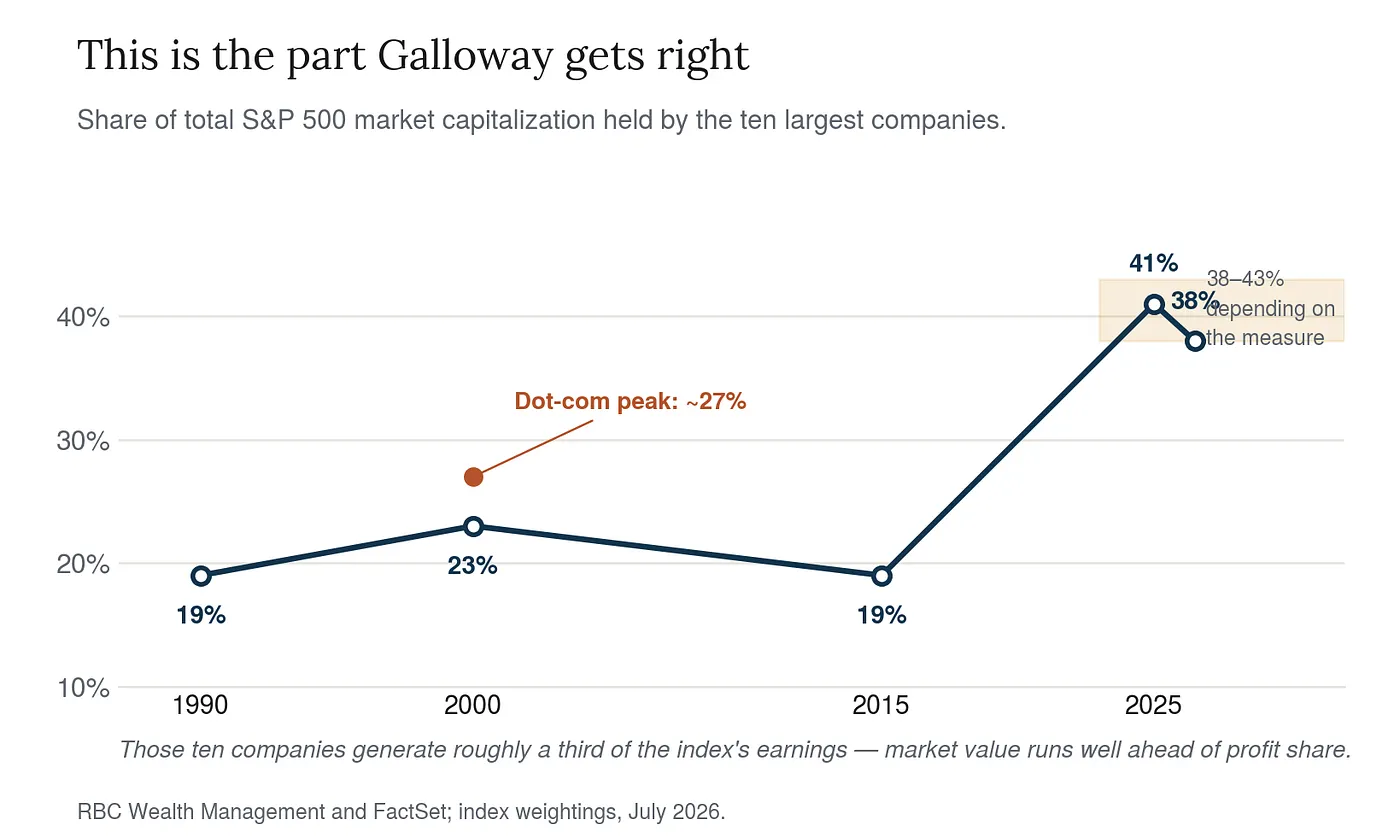
Concentration is the big one. The ten largest companies in the S&P 500 account for somewhere between thirty-eight and forty-three percent of the index depending on the measure and the day. At the dot-com peak that figure was about twenty-seven percent. Those ten companies generate roughly a third of the index’s earnings, so the market capitalization share runs well ahead of the profit share. Anyone who owns a broad market index fund owns a concentrated bet on this trade, whether or not they know it.
The macroeconomic dependency is real too, and larger than in 1999. Artificial intelligence investment accounted for roughly seventy-five percent of the increase in first-quarter 2026 GDP growth, and about thirty-nine percent of marginal GDP growth over the trailing four quarters, against technology’s twenty-eight percent contribution at the height of the dot-com boom. Strip the investment out of the first half of 2025 and growth would have been about a tenth of a percent annualized. That is a genuine fragility and Galloway is right to name it.
And OpenAI’s advertising projection is not defensible. The company has told investors to expect two and a half billion dollars in advertising revenue this year and a hundred billion by 2030. eMarketer’s June forecast puts the entire American standalone chatbot advertising market at just over five billion dollars by 2030. The comparison is not perfectly like for like, since OpenAI’s figure is global and eMarketer’s category is narrow, and the same firm projects a broader American AI advertising market of sixty-eight billion by 2030. But the gap is not a modeling quibble. It requires advertisers to abandon search en masse, one company to dominate a mature market, and a new format to outperform every ad format in history, all at once. Galloway is right that this looks like a hope rather than a plan.
The right thing to be worried about
Goldman Sachs, which believes consensus is underestimating the scale of the buildout by roughly fifty percent, still warns that with so much already priced in, markets are “more vulnerable to news that challenges an optimistic view.” Both halves of that sentence are true simultaneously, and holding them together is harder than picking one.
The most useful line in the whole discourse came from an OpenAI researcher and got picked up on The AI Daily Brief: “Not enough people are emotionally prepared for if it’s not a bubble.” The bubble framing is comfortable because it comes with a script. You know how the story ends, you know who the fools were, and you know that afterward things return to normal. The alternative, where the technology is real and the buildout is roughly correctly sized and the disruption arrives on schedule, has no comparable script.
The honest position is that the dot-com analogy fails at the level of mechanics. The revenue is real and growing at a pace no prior platform shift matched. The customers are solvent. The margins on serving those customers are healthy and improving. The infrastructure is being paid for with a mix of enormous cash flows and increasing but still conservative leverage. Enterprises tightening their spending are behaving exactly like enterprises that intend to keep spending.
What can still go badly wrong is not that the technology fails. It is that the returns arrive on a slower schedule than the debt and the multiples assume, and that a market where ten companies are forty percent of the index has very little room to absorb that disappointment. As Ethan Mollick put it while watching people argue about how to organize work around the newest models: “Nobody has enough experience to reach any real conclusions.”
That is a better reason for humility than a twenty-seven-year-old analogy.
Sources
The piece under discussion
- Scott Galloway, “1999.AI,” No Mercy / No Malice, July 17, 2026. Also published on Medium. The audio edition is behind a Prof G+ subscription.
The AI Daily Brief, hosted by Nathaniel Whittemore
- The AI Chart Everyone Is Getting Wrong, June 12, 2026 — the token index teardown.
- Why Only AI Training Can Save the Economy, June 16, 2026 — spending caps and the token-efficiency turn.
- A Big Shift in the AI Race, June 17, 2026 — the leaked OpenAI numbers.
- The Right Way to Deal With AI Data Centers, June 23, 2026 — water and power in context.
- CEO-Led AI Gets 3X the ROI, June 25, 2026 — the KPMG findings.
- How Big Is the AI Economy?, June 30, 2026 — the Exponential View report.
- AI Companies Are Hiring More, July 2, 2026 — the jobs data.
The token expenditure index
- Citadel Securities, “Tokenomics,” Global Macro Strategy, June 2026.
- Silicon Data, LLM Token Expenditure Index.
- Silicon Data’s clarification that the index measures price, not expenditure.
OpenAI’s financials
- Ed Zitron, “Exclusive: OpenAI Losses Increased Nearly 8X in 2025”, Where’s Your Ed At, June 2026.
- Fortune, “OpenAI’s financials have leaked”, June 16, 2026.
- Axios, “OpenAI projects $100 billion in ad revenue by 2030”, April 9, 2026.
- Adweek, “OpenAI’s Ad Business Is on Pace to Miss Its Own Forecast By 90%”, July 2026, reporting eMarketer’s US AI Advertising Forecast 2026.
Enterprise spending
- Axios, “AI sticker shock hits corporate America”, May 28, 2026.
- KPMG, Global AI Pulse Q2 2026, June 24, 2026, and the full report hub. The US edition covers cost visibility.
The size and shape of the AI economy
- Exponential View, The State of the AI Economy, June 25, 2026. Full report as PDF.
Valuations and financing
- NVIDIA, fourth quarter and fiscal 2026 results, February 25, 2026, and the fiscal 2027 first quarter CFO commentary filed with the SEC.
- FactSet, “Hyperscalers Tap External Financing as AI Capex Outruns Cash Flow”, July 2026.
- Epoch AI, hyperscaler capex versus cash flow, June 2026.
- Anthropic, Series H funding announcement, May 28, 2026.
- On Scott McNealy’s ten-times-revenues remarks, “What a former dotcom CEO’s warning tells us about trillion-dollar valuations”, July 2026.
- RBC Wealth Management, “The Great Narrowing” on S&P 500 concentration.
Jobs
- Ramp Economics Lab and Revelio Labs, “A New Look at AI’s Impact on Jobs”, June 30, 2026. Ramp’s summary and Revelio’s write-up.
- Center for AI Safety and Scale AI, Remote Labor Index, with the methodology paper.
Data centers
- Institute for Energy Research, “Have Data Centers Driven Up Electricity Prices?”, March 19, 2026. Full study as PDF.
- Bloomberg, “How AI Data Centers Are Sending Your Power Bill Soaring”, September 29, 2025. Subscription required.
- PolitiFact, fact-check on how the 267 percent figure has been used, June 12, 2026.
- The Daily Economy, “Data Center Panic Gets Electricity Prices Wrong”, May 2026, which reconciles the two studies above.