- Local grids cannot absorb the gigawatt-scale demand pulses now coming from AI datacenters without forcing ordinary households to subsidize the build-out; in Virginia, the Joint Legislative Audit and Review Commission estimated that data center growth could add $14 to $37 per month to a typical residential Dominion bill by 2040 in constant dollars, and PJM’s interconnection queue has been so backlogged that projects becoming operational in 2025 had waited an average of eight years.
- Conventional and even renewable solutions individually fall short: coal and simple-cycle gas generation cost the climate and water table dearly; small modular reactors will not reach commercial operation in numbers before 2030; and on-site wind and solar — even where buildable — face NEPA review delays, ecological-impact litigation, and intermittency that is mismatched to a load draw doubling on millisecond timescales.
- Solid Oxide Fuel Cells (SOFCs), already deployed at gigawatt scale by Bloom Energy and now anchoring a $2.6 billion, 328-MW Nebius deal signed May 14, 2026, can deliver behind-the-meter electricity in 90 to 120 days, hit roughly 60% electrical efficiency (and over 65% in pressurized SOFC-gas-turbine hybrids like Mitsubishi’s MEGAMIE), produce a nitrogen-free exhaust that simplifies carbon capture, transition from natural gas to green hydrogen, and — paired with graphene supercapacitors of the kind Skeleton Technologies is now producing in Germany — can absorb the brutal load swings of GPU training clusters. The right federal and state policy posture would no longer treat on-site generation as an exotic option but as the default mode of building AI infrastructure, turning datacenters from grid burdens into grid assets.
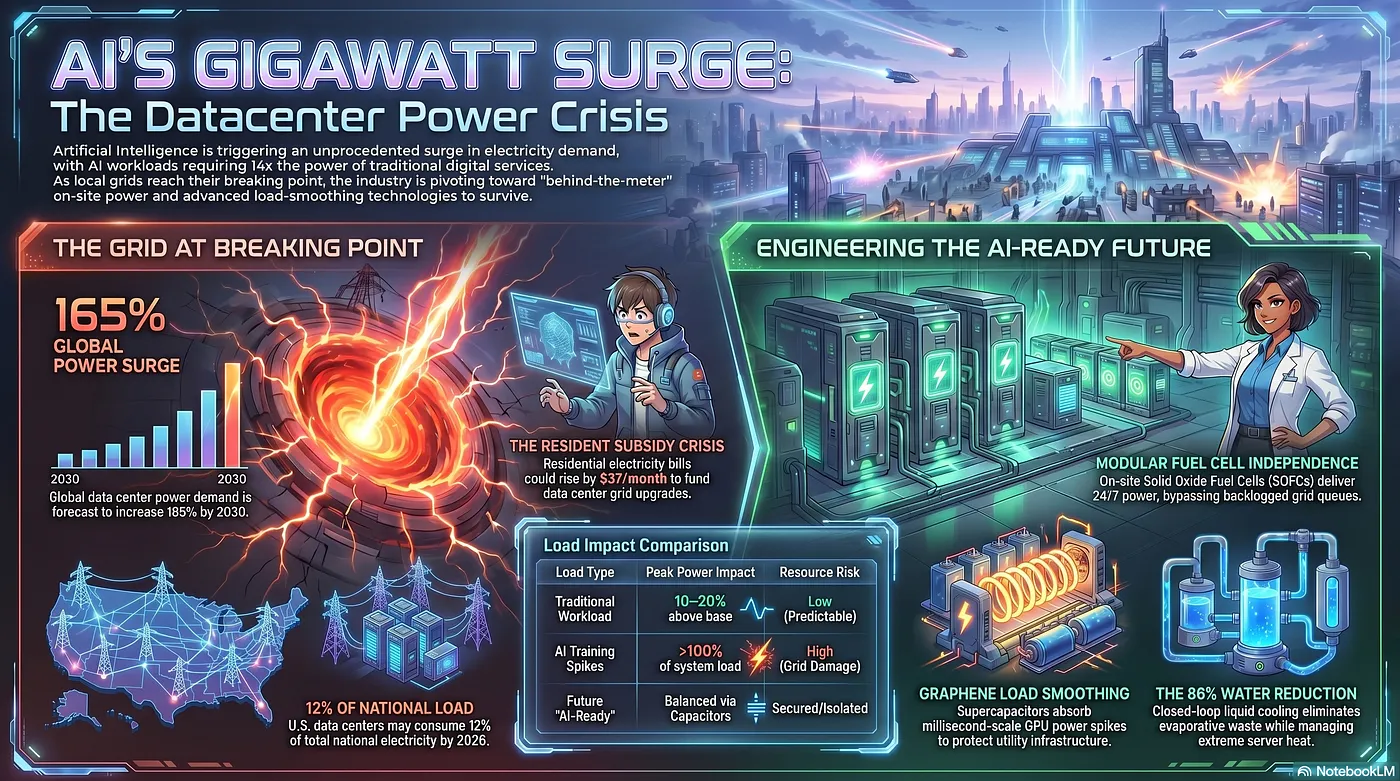
AI’s Gigawatt Surge: The Datacenter Power Crisis — Infographic generated by Google Gemini
Key Findings
The scale of the load is no longer in dispute. Lawrence Berkeley National Laboratory’s 2024 United States Data Center Energy Usage Report — the congressionally mandated update under the Energy Act of 2020 to the 2016 baseline, led by Berkeley Lab staff scientist Arman Shehabi — found that U.S. data center electricity consumption climbed from 58 terawatt-hours (TWh) in 2014 to 176 TWh in 2023, equal to 4.4% of national electricity demand, and projected a range of 325 to 580 TWh by 2028 (6.7% to 12% of U.S. electricity). Goldman Sachs Research’s report “AI to Drive 165% Increase in Data Center Power Demand by 2030,” published February 4, 2025 and authored by senior equity research analyst James Schneider, finds: “Goldman Sachs Research forecasts global power demand from data centers will increase 50% by 2027 and by as much as 165% by the end of the decade (compared with 2023),” requiring “about $720 billion of grid spending through 2030.”
The local grid is the bottleneck. PJM Interconnection, which serves 67 million people across 13 states, projects more than 30 GW of net new electricity demand between 2024 and 2030 — most of it from data centers — and only completed its post-2022 queue reform “Transition Cycle 1” in 2025. Dominion Energy reported in early 2025 that it had approximately 40 GW of data center capacity in various stages of contracting, growing to roughly 47 GW by October 2025 — about triple Dominion’s current peak load. Statewide data center power requests in Virginia now total roughly 70,000 MW per SCC filings.
The cost is being socialized. Virginia’s JLARC concluded in December 2024 that a typical Dominion residential customer “could experience generation- and transmission-related costs increasing by an estimated $14 to $37 monthly in constant (or real) dollars by 2040.” The PJM capacity auction held in December 2025 attributed roughly $6.5 billion of $16.4 billion total — about 40% — to data center load. A January 16, 2026 Global Strategy Group poll commissioned by CCAN Action Fund (composed of 800 likely voters from Virginia) reported that “Seventy-three percent of Virginians blame data centers for rising electricity costs, with nearly a third blaming them ‘a lot.’” A separate Washington Post–Schar School poll in April 2026 found voter comfort with a new data center in their community had plunged to 35%, down from 69% in 2023.
The infrastructure underneath is old. A 2015 U.S. Department of Energy infrastructure review found that 70% of U.S. power transformers were 25 years or older, 60% of circuit breakers were 30 years or older, and 70% of transmission lines were beyond 25 years old. The American Society of Civil Engineers’ 2025 Report Card for America’s Infrastructure (released March 25, 2025) downgraded the energy sector from C− (2021) to D+, explicitly noting that “The sector faces big challenges as the U.S. turns more toward electrification in daily life, with demand experiencing its highest growth in two decades, largely attributable to the ascendency of electric vehicles, data centers, and artificial intelligence.”
Policy is in flux. Washington’s HB 2515 (2026), sponsored by Rep. Beth Doglio, would have created a regulatory regime for “emerging large energy use facilities” above 20 MW; it died in the Senate, but companion bill SB 5982 advanced. Virginia’s SB 253 (sponsored by Sen. L. Louise Lucas, branded the “Fair and Affordable Electric Rates and Reliability Act”) and HB 1393 (sponsored by Del. Destiny LeVere Bolling) were passed in 2026 to shift grid-upgrade costs from residential ratepayers onto data centers above 25 MW demand or 75% annual load factor; the SCC projects a 3.4% residential rate reduction (about $5.52 per month) and a 15.8% data-center rate increase, effective January 1, 2027. Executive Order 14141 (January 14, 2025) was rescinded by the July 2025 Trump executive order “Accelerating Federal Permitting of Data Center Infrastructure,” which retained federal-lands availability but stripped the clean-energy and DEI obligations.
SOFCs are real, not theoretical. Bloom Energy has deployed more than 1.5 GW of SOFC capacity across more than 1,200 sites globally, including CoreSite’s SV9 (Milpitas, CA) and BO1 (Boston, MA) data centers. The Nebius–Bloom Energy agreement, announced May 20, 2026, commits to 328 MW of installed SOFC capacity in 2026 under a contract worth up to $2.6 billion in service fees, replacing the gas turbines and reciprocating engines Nebius had originally specified.
Hybrid SOFC-gas-turbine and downstream carbon capture work. Mitsubishi Power’s MEGAMIE pressurized SOFC + micro-gas-turbine line, first commercialized at the Marunouchi Building in Tokyo in February 2019, reports more than 65% electrical efficiency and more than 73% combined-heat efficiency. FuelCell Energy and ExxonMobil broke ground in October 2024 on a molten carbonate fuel cell carbon-capture pilot at the Esso Nederland Rotterdam complex; ExxonMobil’s published claim is that the technology “could capture more than 90% of CO₂ emissions.”
Supercapacitors are the load-smoothing match for SOFCs. Skeleton Technologies opened a €220 million graphene-supercapacitor SuperFactory near Leipzig on November 28, 2025; its GrapheneGPU peak-shaving unit, validated under hyperscaler workloads, is rated to cut AI datacenter electricity consumption by 44% and boost compute throughput by 40% by absorbing the millisecond-scale swings that, per the Uptime Institute, can exceed 100% of system-level steady-state load.
Details
Section 1 — The Problem: Demand Outruns the Wires
The numbers tell a story the grid cannot. In December 2024, the U.S. Department of Energy released the 2024 United States Data Center Energy Usage Report, produced by Lawrence Berkeley National Laboratory under the Industrial Efficiency and Decarbonization Office. The report estimates that U.S. data centers consumed 58 TWh in 2014, climbed to 76 TWh by 2018, and reached 176 TWh by 2023, at which point they accounted for 4.4% of total U.S. electricity. The future range is wider and more violent: 325 to 580 TWh by 2028, or 6.7% to 12% of national electricity. The Congressional Research Service report R48646 reiterates these figures and notes that an industry report from late 2024 counted 6,350 MW of new datacenter capacity under construction in North America at the close of that year — more than double a year earlier — with hyperscale facilities running 100 MW to 1,000 MW apiece, “roughly equivalent to the load from 80,000 to 800,000 homes.” Goldman Sachs Research’s analyst James Schneider goes further: global data center power demand is forecast to rise 165% by 2030 from 2023 levels, with 40% of new demand to be met by renewables, modest nuclear additions, and the remaining 60% by natural gas — implying 215 to 220 million tons of cumulative additional CO₂ emissions through 2030. Boston Consulting Group’s 2025 report “Breaking Barriers to Data Center Growth” projects total global data center power demand of roughly 130 GW by 2028, a 16% CAGR from 2023 (accelerating from 12% in 2020–2023), with the U.S. alone accounting for 81 GW and hyperscalers driving 60% of incremental demand growth.
Nowhere is this collision more acute than Virginia. The Joint Legislative Audit and Review Commission’s December 2024 report, modeled by the consulting firm E3 using the University of Virginia Weldon Cooper Center’s load growth scenarios, found that unconstrained data center growth would raise Virginia’s electricity usage by 183% by 2040 against a counterfactual of 15% growth without data centers. Dominion Energy projects 70% summer peak load growth from 2022 to 2045. As of its 2025 IRP, Dominion had approximately 47 GW of contracted data center capacity beyond current demand — roughly triple its peak load — with the queue still growing. The pipeline is concentrated: 60% of expected load growth is in cooperative service territories like Northern Virginia Electric Cooperative, not in Dominion or Appalachian Power.
The cost is the politically explosive part. JLARC’s headline finding was that “a typical residential customer of Dominion Energy could experience generation- and transmission-related costs increasing by an estimated $14 to $37 monthly in constant (or real) dollars by 2040 (independent of inflation).” Dominion’s 2024 IRP testimony before the Virginia SCC further conceded that of $7.6 billion in planned new transmission infrastructure, residential customers would pay 55%, including for assets serving only data centers. Polling cited in legislative debate over SB 253 — specifically a January 16, 2026 Global Strategy Group poll commissioned by CCAN Action Fund — found that 73% of Virginia likely voters blame data centers for rising electricity costs.
PJM’s queue has been the single most visible bottleneck. The regional transmission organization effectively shut its queue in 2022 to rework its processes, and projects that became operational in 2025 had waited an average of eight years to interconnect — far longer than the two- to three-year forward window in which PJM’s capacity auctions clear. The 2026/2027 Base Residual Auction came in at $16.1 billion, up roughly 10% year over year and seven times the $2.2 billion of two cycles earlier. Aurora Energy Research’s counterfactual modeling suggests that even completing a fraction of the 130 GW of pre-2024 capacity-eligible projects in PJM’s queue could have saved consumers about $3.5 billion. PJM has promised one-to-two-year interconnection processing times under its reformed cycle, but no project that has cleared Transition Cycle 1 was studied with full deliverability assumptions; Provisional Interconnection Service and the Reliability Resource Initiative (some 8,000 MW across 41 projects) are stopgaps, not solutions. CAISO and MISO both froze their queues at various points in 2023–2024 to implement reforms under FERC Order №2023; ERCOT operates outside FERC jurisdiction but faces its own seven-year wait times for new natural-gas turbine orders.
The grid that all this load is trying to land on is not new. The U.S. DOE’s 2015 grid infrastructure review — re-cited consistently by the White House, ASCE, and the Joint Economic Committee — found that 70% of U.S. transmission lines, 70% of power transformers, and 60% of circuit breakers had already crossed 25 to 30 years of service against design lives of 50 to 80 years. ASCE’s 2025 Report Card downgraded energy infrastructure from C− to D+. EIA data on outage minutes shows the typical American customer was without power for slightly more than seven hours in 2021, more than five of those hours during major events; weather-related outage costs alone run about $150 billion per year to the U.S. economy, according to DOE. Grid Strategies estimates that 30% of American Electric Power’s 40,000 miles of transmission will need replacement within ten years. Brattle Group’s 2021 analysis estimated transmission-replacement spending alone would run roughly $10 billion per year.
Load growth is also harder to manage than its headline aggregate suggests because AI workloads are uniquely bursty. The Uptime Institute has documented “power excursion events” — millisecond spikes in which GPU draw exceeds Thermal Design Power as soon as a training batch begins, with system-level fluctuations sometimes exceeding 100% of steady-state load. Meta’s Llama 3 paper acknowledged power-management problems even at 24,000 H100s (about 30 MW of IT capacity); large-scale GPU clusters can produce instantaneous fluctuations on the order of tens of megawatts, “stretching the limits of the power grid,” in the paper’s words. A 2025 arXiv paper by Patel et al. (“Power Stabilization for AI Training Datacenters,” 2508.14318) warns that the frequency spectrum of these swings, if harmonized with critical utility frequencies, can cause physical damage to grid infrastructure. Oracle Cloud Infrastructure engineers describe Adaptive Excursion Threshold (AET) software smoothing as “a software complement to hardware smoothing” — implicitly conceding that the hardware layer needs work the software can only partially compensate for. Bloom Energy’s collateral, written by founder KR Sridhar and former Lawrence Berkeley engineer Peter Gross, claims SOFCs can follow AI load swings between 20% and 150% in milliseconds, “multiple times per minute,” without battery support — but that claim is precisely the kind of vendor argument the supercapacitor industry, led by Skeleton Technologies, contests.
The reliability case for grid independence is no longer hypothetical. NERC’s Long-Term Reliability Assessments and the FERC-NERC Final Report on the February 2021 Cold Weather Outages in Texas and the South Central United States (issued September 2021) make complementary arguments. Winter Storm Uri caused 61,800 MW of generation outages, with ERCOT ordering 20,000 MW of rolling blackouts — the largest manually controlled load shed in U.S. history. Some 4.5 million Texans lost power; loss of life was substantial. The FERC-NERC report’s central finding was that 75.6% of unplanned outages came from a combination of freezing (44.2%) and fuel-supply issues (31.4%), with natural gas wells and gathering compressors losing power exactly when power plants needed gas — a death spiral of inter-dependency. As ERCOT’s own Q1 2026 reporting confirms, even with 99 GW of expected available capacity for January 2026 against 183 GW installed, forced outages from dispatchable plants this past winter still peaked at 13 GW. A national security argument flows directly from this: an AI infrastructure footprint anchored to the existing grid is anchored to the most fragile single point in American infrastructure.
Section 2 — Why Conventional Generation Is the Wrong Answer
Coal, natural gas, and large-scale nuclear all have a problem that on-site, behind-the-meter SOFCs do not: they cannot be deployed at the AI infrastructure cadence and they each carry a legacy that will be measured in either tons of carbon, billions of gallons of evaporated cooling water, decades of regulatory friction, or all three.
Begin with the carbon and water math. EIA’s 2021 generation data show coal-fired generation withdrew an average of 19,185 gallons of water per MWh and natural gas combined cycle units 2,803 gal/MWh, with the fleetwide thermoelectric average sitting at 11,595 gal/MWh. EPA’s eGRID 2022 average carbon intensity for the U.S. grid was 823.1 lbs CO₂/MWh. According to EIA, natural gas as fired emits roughly 117 lbs CO₂ per million Btu against coal’s 209 lbs/MMBtu, and combined cycle plants average about 865 lbs CO₂/MWh while simple-cycle peakers run 1,100 to 1,300 lbs/MWh. A 100-MW datacenter that operates at high utilization on simple-cycle gas can emit close to a million metric tons of CO₂ in a year, and consume tens of millions of gallons of evaporated water — most of it lost to cooling-tower drift.
The AI sector has its own emissions footprint to reckon with. Emma Strubell, Ananya Ganesh, and Andrew McCallum’s 2019 ACL paper, “Energy and Policy Considerations for Deep Learning in NLP,” estimated that the Transformer (big) model with neural architecture search emitted 626,155 lbs CO₂e — about five times the lifetime emissions of an average American car (126,000 lbs). David Patterson et al. of Google, in their 2021 arXiv paper “Carbon Emissions and Large Neural Network Training” (arXiv:2104.10350), estimated GPT-3’s training run at 552 metric tons CO₂e and 1,287 MWh. Shaolei Ren and colleagues at UC Riverside, in “Making AI Less Thirsty” (arXiv:2304.03271), computed that training GPT-3 in Microsoft’s U.S. data centers directly evaporated about 700,000 liters of clean fresh water — a figure the Washington Post extended in September 2024 to find that generating a single 100-word email with GPT-4 evaporates roughly 519 mL.
Nuclear deserves a careful look because the hyperscalers have leaned into it hard. Microsoft and Constellation Energy signed a 20-year, ~835 MW Power Purchase Agreement in September 2024 to restart Three Mile Island Unit 1 (rebranded the Crane Clean Energy Center) at a cost of roughly $1.6 billion — Constellation expects the plant back online in 2028, pending NRC review. Google signed a Master Plant Development Agreement with Kairos Power in October 2024 covering up to 500 MW across six to seven small modular reactors, with the first unit (a 50 MW Hermes 2 deployment at TVA’s Oak Ridge site) scheduled for 2030 and the balance through 2035. Amazon Web Services committed in October 2024 to invest in X-energy and target 5 GW of Xe-100 deployment by 2039; in June 2025 Talen Energy signed a 20-year, 1,920 MW PPA with AWS from the Susquehanna nuclear plant, with full ramp by 2032 and an option to extend to 2042. The economics are real but the timeline is the issue. Hermes 2 is scheduled for 2030 commissioning. The first multi-unit Xe-100 Cascade Advanced Energy Facility at the Columbia Generating Station site in Washington targets construction by 2030. Even Three Mile Island, with an already-licensed plant and existing transmission interconnection, faces an NRC review that Constellation acknowledged would extend into 2027. The DOE Pathways to Commercial Liftoff: Advanced Nuclear report finds that demand aggregation from large power consumers could enable serial deployment by the early 2030s; that is precisely the wrong end of the decade for AI infrastructure being built now. SMRs are unproven at commercial scale and face significant NRC licensing hurdles; only the Palisades restart in Michigan (planned for late 2025) and the planned Crane restart will precede them.
Natural gas at hyperscale is no safer a bet. Texas’s Winter Storm Uri remains the canonical warning: in February 2021, between 5 and 7 GW of gas-fired generation that ERCOT had scheduled to operate between February 15 and 17 simply could not be dispatched because frozen wellheads and unidentified critical gas-pipeline loads were knocked offline. Beyond the catastrophic case, gas turbine lead times have lengthened: GE Vernova reported in December 2024 that its turbines are sold out through 2028, with less than 10% remaining in 2029. Pipeline capacity into demand basins like the Mid-Atlantic is also constrained — and the December 18, 2025 FERC order requiring PJM to overhaul its rules for co-located and behind-the-meter large loads explicitly cited the cost-causation problem of letting BTMG output net peak transmission charges. Gas, in short, is the conventional answer that policymakers will let datacenter developers reach for but should not.
Section 3 — Wind, Solar, and Their Limits
If conventional generation cannot scale safely or fast enough, the natural alternative is utility-scale wind and solar, particularly in the windbelt running from Texas through Iowa, Nebraska, Montana, and South Dakota. But here, three frictions interact: ecological-impact review timelines, the mismatch between transmission geography and load geography, and the structural intermittency of variable renewables.
Hyperscalers have built impressive renewable portfolios. Microsoft has a 250 MW solar project under construction in Portage County, Wisconsin, supporting its newest AI data center; Amazon claims it has achieved 100% renewable energy across global operations, seven years ahead of schedule (a claim that depends on accounting treatment of unbundled RECs and 24/7 carbon-free energy matching, both of which have credible critics). Apple, Google, and Meta have similarly aggressive PPAs. The first-order critique is well known: Renewable Energy Certificates and virtual PPAs do not solve the local grid strain problem because they are accounting instruments that match generation in one node of a grid to consumption in another. They can decarbonize the books without decarbonizing the actual electrons consumed by a hyperscale data center in Ashburn or Atlanta.
The second friction is permitting. NEPA review for utility-scale solar or wind on federal lands routinely takes three to five years, and Bureau of Land Management Programmatic Environmental Impact Statements can delay project initiation longer still. The Council on Environmental Quality reform language in the Trump July 2025 executive order seeks new categorical exclusions for “Qualifying Projects,” but Section 5’s directive applies primarily to data center build-out, not to the renewable generation that would serve them. Recent project history is instructive: large-scale solar projects in Nevada’s Pahrump Valley and Wyoming have been delayed or rejected on desert tortoise, sage grouse, and golden eagle grounds; offshore wind in Massachusetts (Vineyard Wind) and Virginia (Coastal Virginia Offshore Wind) has experienced repeated permitting and litigation delays. The Coastal Virginia Offshore Wind project recently saw its price rise 10% to $10.7 billion.
The third friction is geography. The U.S. windbelt is far from datacenter load centers in Ashburn, Atlanta, Dallas, and Columbus. High-voltage direct current (HVDC) projects like the SunZia transmission line from New Mexico to Arizona, or the Grain Belt Express from Kansas to Indiana, are the only credible delivery mechanism, and each has taken 10 to 15 years from initial filing to commercial operation. The DOE’s Bipartisan Infrastructure Law allocations — $30 billion for transmission catalysis and an additional $1.3 billion for interstate transmission lines — are real, but the policy assumption that they can build the windbelt-to-Ashburn corridor on AI infrastructure’s three-year build cycle is unsupported by historical permitting times.
Intermittency itself is the final, structural problem. Solar capacity factors in the southwestern U.S. run roughly 27–30%; onshore wind in the central U.S. windbelt about 35–43%. A 100 MW data center demanding 99.99% uptime cannot be served by a 100 MW solar field; it requires that field plus dispatchable backup plus storage plus interconnection capacity that handles import on cloudy days and export on sunny ones. The economics work in regulated, decoupled hubs (where capacity, energy, and ancillary services are unbundled), but the speed-to-power constraint that drove Nebius from gas turbines to Bloom Energy is exactly the constraint that pushes hyperscalers away from on-site wind and solar as a primary generation choice.
Wind and solar therefore belong in the AI infrastructure stack as REC- and PPA-backed components of long-term decarbonization and as opportunistic on-site assets where land and ecology permit — but they are not the load-following, 24/7 firm answer to a 200 MW training cluster’s call for power tomorrow.
Section 4 — Solid Oxide Fuel Cells as the Cutting-Edge Answer
The Solid Oxide Fuel Cell is, in its essential operation, an electrochemical device with no moving parts in the power-conversion path. A ceramic electrolyte conducts oxygen ions from a cathode to an anode at operating temperatures of roughly 700 to 900 degrees Celsius; fuel (methane, syngas, biogas, or hydrogen) delivered to the anode reacts with the migrated oxygen, releasing electrons that pass through an external circuit to do useful work and leaving water and carbon dioxide (when running on natural gas) or only water (when running on hydrogen) as the by-products. Because the reaction is electrochemical rather than combustive, the exhaust contains essentially no nitrogen oxides (NOx), sulfur oxides (SOx), particulate matter, or unburned hydrocarbons — and because no atmospheric nitrogen enters the reaction zone, the carbon dioxide that does emerge is concentrated rather than diluted across an exhaust plume.
The efficiency numbers are well-documented. The U.S. Department of Energy’s National Energy Technology Laboratory (NETL) SOFC Program targets greater than 60% electrical efficiency without carbon capture and storage at system costs below $900/kW and stack costs below $225/kW. Stationary SOFC systems already report 45 to 60% electrical efficiency in published literature, with high-efficiency hybrid architectures reaching higher; a 2024 MDPI paper modeling SOFC integration with a Rankine cycle and CCUS technology reported an overall efficiency of 71.64% with 67.70% electrical efficiency. The IEA Advanced Fuel Cells task confirms electrical efficiencies above 60% in current commercial SOFC and MCFC systems, “above 80% overall efficiency when also including the heat output,” and notes that part-load efficiency exceeds full-load efficiency — a thermodynamic property uniquely valuable for load-following data center applications. A 2025 Frontiers in Energy Research review by Corigliano et al. notes that integration of a Brayton cycle with SOFCs “can lead to efficiencies exceeding 60%, making it a popular choice for high-performance stationary power plants.”
The most concrete commercial expression of these numbers is the Bloom Energy product line. The Energy Server 5 (ES5) 250 kW model carries an LHV net AC electrical efficiency of 65% at beginning of life and 53% at end of life, with a heat rate of 5,811 to 7,127 Btu/kWh, and NOx emissions of 0.0017 lbs/MWh — well below the level at which Title V air permits become onerous. Per Bloom’s CT PURA-filed Energy Server 5 specification sheet, the unit’s footprint is roughly 14′4″ × 8′8″ × 6′9″, or about 125 sq ft per 250 kW — which yields roughly 500 sq ft per MW. CoreSite explicitly states that “fuel cells can deliver double that — up to 100 megawatts in an acre” once units are deployed in a four-high stacked configuration, against 50 megawatts per acre for gas turbines and reciprocating engines.
The deployed track record is now substantial. Bloom Energy reports more than 1.5 GW deployed across more than 1,200 sites globally; the company stated in its Q3 2025 earnings release that it is doubling annual manufacturing capacity from roughly 1 GW to 2 GW by December 2026, on a $100 million capital investment. CoreSite’s blog explicitly identifies SOFC deployment at the SV9 data center in Silicon Valley (Milpitas) and at the BO1 data center in Boston as creating a “hybrid utility + fuel cell power solution.” Equinix has signed a deal for SOFC deployments across 19 data centers with capacity exceeding 100 MW. American Electric Power placed a 100 MW utility-scale order — Bloom’s first directly to a U.S. investor-owned utility — for AI data center off-grid service. The Brookfield Asset Management partnership, announced October 13, 2025, is worth up to $5 billion in deployment capital and includes a planned European AI factory site.
The single most consequential recent deal is Nebius Group’s. On May 14, 2026, Nebius and Bloom Energy signed an agreement worth up to $2.6 billion in service fees across three ten-year phases, with the first phase covering 328 MW of installed capacity (roughly 250 MW of guaranteed capacity) and operational this year. Nebius’s announcement explicitly notes that the fuel cells “replace previously planned combustion-based technology at first US deployment” — Nebius had originally specified gas turbines or reciprocating engines. Andrey Korolenko, Nebius’s Chief Product and Infrastructure Officer, framed the choice this way: “Power remains a key constraint for AI infrastructure build-outs.”
Bloom claims it can deliver 50 MW of fuel cells in as little as 90 days and 100 MW in 120 days “if gas supply and permits are in place,” a figure that compares favorably to gas turbines sold out through 2028 and to nuclear restart timelines extending into 2027–2030. Bloom’s KR Sridhar and Peter Gross’s white paper “Fuel Cells: A Technology Whose Time Has Come” further notes that SOFCs follow load swings between 20% and 150% in milliseconds — a property that, while contested, follows from their solid-state architecture and the absence of rotational inertia or combustion-cycle latency.
The water and carbon-capture story is qualitatively different from any combustion technology. A combustion turbine running on natural gas requires substantial cooling water and produces an exhaust stream dominated by nitrogen — the same nitrogen that entered the combustion chamber as air. To capture the carbon dioxide from that stream, an operator must separate roughly 4% to 12% CO₂ from 78% N₂ plus combustion products — energetically expensive and capital-intensive, typically requiring monoethanolamine (MEA) scrubbing that consumes 20% to 30% of the plant’s net output. A SOFC, by contrast, reacts methane and oxygen ions in a sealed electrochemical cell. The anode exhaust is concentrated CO₂ and water vapor. Condensing the water and capturing the remaining CO₂ stream is far closer to a refrigeration-cycle problem than a chemical-separation problem. A paper by Iyengar et al. (PNNL-SA-147003, published in the Journal of Energy Resources Technology) analyzes a Natural Gas Solid Oxide Fuel Cell System “with and without carbon capture,” explicitly targeting at least 90% carbon capture. The MDPI hybrid system paper cited above describes a net-zero carbon-footprint SOFC system at 67.70% electrical efficiency.
The water side is equally compelling. The electrochemical reaction CH₄ + 2 O₂ → CO₂ + 2 H₂O produces two moles of water per mole of methane. Bloom Energy’s published datasheets specifically state: “No water consumption during normal operation.” Practically, this means a Bloom-powered data center neither evaporates water in cooling towers (because the SOFC’s high-grade waste heat can be used for absorption chillers or in dry-coolers) nor consumes water for steam-cycle generation. When the water produced by the reaction is captured rather than vented, the SOFC genuinely is a net water producer at the system boundary — a property no thermal power plant can match. Bloom’s Aman Joshi, Chief Commercial Officer, framed the comparative case in the April 2026 announcement of the Oracle “Project Jupiter” deployment with Bloom in the Borderplex region: “Our energy solution not only dramatically reduces water use, it is also cleaner, quieter, and helps protect electricity rates for local residents.”
The hydrogen-readiness pathway is the third major argument. Bloom’s Energy Server is fuel-flexible: it can run on natural gas, blended hydrogen, biogas, or pure hydrogen. The Energy Server 5 Hydrogen variant — a dedicated H₂ unit — extends the same architecture to a zero-carbon fuel input. The supply chain for green hydrogen is being built around the DOE’s seven Regional Clean Hydrogen Hubs program, authorized under §40315 of the Infrastructure Investment and Jobs Act and announced October 13, 2023 with $7 billion in cost-share funding across hubs in California (ARCHES, $1.2 billion), the Pacific Northwest (PNWH2, $1 billion), the Midwest (HHH2), the Mid-Atlantic (MACH2), Appalachia (ARCH2), Texas/Gulf (HyVelocity), and the heartland. As of January 2025, five of the seven hubs had received initial Phase 1 awards. The final Treasury 45V Clean Hydrogen Production Tax Credit guidance, issued in early 2025, retained the “three pillars” framework (incrementality, time matching, deliverability) with some loosening for retired-nuclear and CCS-retrofit pathways. The DOE Hydrogen Shot target — $1 per kilogram by 2031 — is the cost goal that brings green-hydrogen SOFC operation into parity with grid-power economics; even without it, biogas-fueled SOFCs reach carbon neutrality today, as Bloom’s directed-biogas configuration demonstrates.
The hybrid SOFC-gas-turbine (SOFC-GT or GTFC) architecture promises the highest efficiencies. Mitsubishi Heavy Industries’ MEGAMIE pressurized SOFC + micro gas turbine, launched commercially in November 2018, achieves greater than 65% electric efficiency and greater than 73% combined-heat efficiency. The first commercial MEGAMIE unit operated at Mitsubishi Estate’s Marunouchi Building in Tokyo from February 2019; a second unit was delivered to the Hazama Ando Technical Research Institute in Tsukuba in mid-2019. MHI’s own press materials note that “CO₂ emissions can be reduced by nearly half” compared with conventional generation. A Stanford Physics 240 course paper by Swami (2024) reports that SOFCs produced essentially zero SOx and NOx in comparative studies — 0 lb in SOFC vs. 12,740 lb SOx and 18,850 lb NOx per 1,650 MWh in a fossil-fueled plant.
Other vendors are entering the market. FuelCell Energy uses molten carbonate fuel cells (MCFCs), a different and complementary technology — operating around 600°C and uniquely suited for integrated carbon-capture-from-flue-gas applications. The FuelCell Energy / ExxonMobil pilot at the Esso Nederland Rotterdam complex broke ground in October 2024, supported by a €30.5 million EU Innovation Fund grant, targeting a 46,000-tonne CO₂ reduction over five years and field demonstration starting in 2026. ExxonMobil’s Geoff Richardson framed the unique value proposition: “It not only captures CO₂ but also produces low carbon power, heat, and hydrogen as co-products.” In March 2025, FuelCell Energy, Diversified Energy Company, and TESIAC announced the formation of an Acquisition and Development Company to supply up to 360 MW of electricity from natural gas and captured coal mine methane to data centers in Virginia, West Virginia, and Kentucky; a separate January 20, 2026 collaboration between Sustainable Development Capital LLP and FuelCell Energy targets up to 450 MW of advanced fuel-cell power for data centers globally. Convion (Finland), SOLIDpower (Italy), Doosan, and Mitsubishi compete in the megawatt-class market in Asia.
The comparison to combined-cycle gas turbines (CCGT) is informative. CCGTs hit 55% to 60% electrical efficiency at full load and typically 38% to 45% at part load. Simple-cycle gas turbines run 35% to 40%. SOFCs already deliver 60% at full load and more at part load; hybrid SOFC-GTs approach 70% at full load. Combined with their behind-the-meter siting, modular delivery, near-zero criteria-pollutant emissions, simplified carbon capture, and net-positive water profile, SOFCs represent the most concrete on-site generation architecture that can match the speed-to-power and decarbonization requirements of AI infrastructure today.
Section 5 — Supercapacitors and the Smoothing Problem
A SOFC’s slow electrochemical response, combined with an AI training cluster’s millisecond-scale load swings, leaves a meaningful technical gap. That gap is the reason the SOFC + supercapacitor pairing is the missing half of the on-site generation story.
The Uptime Institute’s published analyses are blunt about the magnitude of the problem. “The difference between the low and high points of power draw during training program execution can exceed 100% on a system level (the load doubles almost instantaneously, within milliseconds) for some configurations.” In worst-case synchronized GPU cluster operation, AI compute can briefly reach 150% of steady-state maximum power, “forcing [the UPS] to use its stored energy” as the UPS is overloaded and unable to meet demand from its internal capacitance alone. The Llama 3 paper noted instantaneous fluctuations of “tens of megawatts” across the datacenter scale, and the SemiAnalysis newsletter’s deep dive identifies intra-batch power excursions on the millisecond timescale, multi-second AllReduce-synchronization dips, and full-job startup/shutdown swings on the order of seconds. As Patel et al. warn in their 2025 arXiv paper, the frequency spectrum of these swings, if it harmonizes with utility critical frequencies, “can cause physical damage to the power grid infrastructure.”
Lithium-ion battery storage is the conventional answer but is structurally mismatched. A lithium-ion UPS module takes seconds to ramp to full output, has a cycle life measured in low thousands, suffers thermal runaway risks, and degrades in capacity with each cycle. A supercapacitor, in contrast, delivers peak power in microseconds, has a cycle life into the hundreds of thousands or low millions, has no chemical thermal runaway path, and operates across a much wider temperature range. Skeleton Technologies’ Curved Graphene supercapacitor offers 3.7 times the power density of lithium-ion capacitors and ESR (equivalent series resistance) up to 50% lower, with a temperature operating range from –40°C to +65°C.
Skeleton Technologies opened its €220 million SuperFactory in Markranstädt, near Leipzig, on November 28, 2025. The factory manufactures the GrapheneGPU peak-shaving capacitor shelf product, which had completed validation under hyperscaler workloads and began shipping in June 2025. Skeleton’s published technical claim — validated under “the most demanding power profiles set by leading hyperscalers” — is that GrapheneGPU reduces AI energy consumption by up to 45%, lowers peak power connection requirements by 44%, and boosts computing performance (FLOPS) by 40%. The product is “ORV3 compatible, 1U-40U high,” with 60 to 160 kW peak power per shelf. U.S. manufacturing expansion is scheduled for the first quarter of 2026 to support international demand. CEO Taavi Madiberk frames the proposition this way: “As AI computing and energy demands double annually, AI data centers are facing a critical bottleneck. GrapheneGPU delivers up to 40 percent more computing with the same energy footprint, while cutting both capital and operating costs by reducing grid upgrade needs, energy waste, and cooling.”
The technical case for pairing supercapacitors with SOFCs runs in both directions. SOFCs benefit because the supercapacitor absorbs the millisecond-scale transients the SOFC’s ceramic electrolyte cannot follow; the SOFC can run smoothly at its design point. The data center benefits because the supercapacitor eliminates the need for “dummy loads” — software-generated artificial compute simply to keep GPU power draw smooth and avoid grid penalties — which is the operating reality of many AI training clusters today and which Skeleton’s data show wastes up to 45% of energy as heat without producing any computation. The grid benefits because the supercapacitor decouples the data center’s electrical signature from the GPU cluster’s electrical noise, removing the harmonic threat to utility infrastructure that Meta’s Llama 3 paper and Patel et al.’s 2025 work both warn about.
Microsoft’s internal work points the same direction in software. Project Forge, the company’s GPU scheduler, treats all available accelerators in Azure as a single virtual pool — what Microsoft calls “One Pool” — and uses machine learning to boost GPU utilization from roughly 50–60% to 80–90% at scale. By Microsoft’s published account, Project Forge has “safely harvested” about 800 MW of unused power from existing data centers since 2019. Project POLCA, a related Azure technology, provisions multiple inferencing operations to share peak power draw with about 20% overhead, allowing Microsoft to deploy roughly 30% more servers per data center by throttling server frequency and power. Storage Accelerator and Project Flywheel address related data-throughput and inference-orchestration problems. These software approaches are best understood as complementary to the hardware story; as the Oracle Cloud Infrastructure engineering team noted in December 2024, “Getting smooth, millisecond-scale control without harming training throughput is non-trivial…our AET-based approach is best viewed as a software complement to hardware smoothing.”
The next architectural step — already implicit in the Nebius–Bloom deal and in Microsoft’s stated Black Hills Energy “Large Power Contract Service” tariff designs — is the integrated on-site generation block: SOFCs as the primary 24/7 generator, hybridized with gas turbines for combined cycle uplift, paired with supercapacitor banks to smooth GPU load profiles into the SOFC’s natural response window, and topped with battery energy storage for longer-duration carryover. This is the architecture that delivers grid independence at the data-center boundary without sacrificing reliability, response time, or carbon performance — and it is the architecture against which all alternatives should now be benchmarked.
Section 6 — Regulatory Environment and Policy Landscape
The regulatory environment for AI infrastructure power in the United States is more fragmented than at any time in recent memory, with the result that operators who plan on-site generation must navigate federal executive orders that may be revoked in the next administration, FERC and ISO/RTO rule changes that are still in transition, state-level data center bills proliferating across more than 30 states, and a Bipartisan Infrastructure Law and Inflation Reduction Act framework whose tax credit guidance is still being interpreted.
The two recent landmark federal actions illuminate the political stakes. Executive Order 14141 of January 14, 2025 — President Biden’s “Advancing United States Leadership in Artificial Intelligence Infrastructure” order — required the Secretary of Defense and the Secretary of Energy to identify at least three sites each on federal land suitable for frontier AI data center leasing by February 28, 2025, with the requirement that those sites be matched with clean energy facilities by the end of 2027. The order tied federal-land siting to clean-energy mandates and to community-benefit and DEI requirements. The Trump July 2025 executive order, “Accelerating Federal Permitting of Data Center Infrastructure,” revoked EO 14141, retained the federal-lands availability for data centers (now defined as facilities requiring greater than 100 MW of new load for AI inference, training, simulation, or synthetic data generation), and stripped the clean-energy and DEI obligations while broadening categorical exclusions under NEPA and instructing the EPA to expedite permitting under the Clean Air Act, Clean Water Act, CERCLA, and Toxic Substances Control Act for “Qualifying Projects” exceeding $500 million in capital investment.
The DOE in November 2025 issued a Request for Information seeking industry input on co-locating data centers with nuclear reactors, enhanced geothermal systems, fuel cells, carbon capture, energy storage systems, and portfolios of on-site technologies on federal lands. The RFI also includes lands DOE had identified under the Cleanup for Clean Energy Initiative — 35,000 acres across five former nuclear weapons sites — for clean energy generation. The Trump-era RFI deliberately does not require clean energy as the Biden order had; it asks for industry preference among nuclear, geothermal, fuel cells, carbon capture, and storage.
At the state level, more than 300 data center bills were filed across 30+ states in just six weeks of 2026. Virginia’s SB 253 (Sen. L. Louise Lucas, branded the “Fair and Affordable Electric Rates and Reliability Act”) and HB 1393 (Del. Destiny LeVere Bolling) applied to customers with demand at or above 25 MW or annual load factors at or above 75%; the SCC projected a 3.4% residential rate reduction (about $5.52 per month) and a 15.8% data-center rate increase if the bills’ cost-shift mechanism were implemented from January 1, 2027 through 2033. Governor Spanberger’s April 16, 2026 amendments softened the shift mechanism; the General Assembly rejected most amendments on April 22, 2026 and re-sent the original bills to her desk. Washington’s HB 2515, sponsored by Rep. Beth Doglio, addressed “emerging large energy use facilities” above 20 MW with three core provisions: utility tariffs preventing cost shifts; mandatory sustainability reporting on energy, water, refrigerant, and emissions; and elimination of free carbon credits beginning in 2028. HB 2515 passed the House 51–41 but died in the Senate; companion bill SB 5982 advanced, requiring large customers including data centers to meet the same Clean Energy Transformation Act deadlines as utilities. Maryland’s SB 596/HB 940 takes a different approach, encouraging data centers to participate in demand response programs. Oklahoma’s SB 1488 places a moratorium on data centers with electrical load above 100 MW until November 1, 2029. Ohio’s PUCO settlement with AEP Ohio establishes 90% minimum demand charges and 10-year contracts for data center customers. Indiana’s HB 1333 requires data centers to send a portion of sales taxes to local governments.
FERC Order 2023, the interconnection-queue reform issued in 2023, is the federal framework restructuring how new generation and large loads connect to the grid. PJM’s Transition Cycle 1 implements the reform; future cycles will face one-to-two-year processing time targets. ERCOT operates outside FERC jurisdiction. CAISO and MISO have been processing backlogs through 2024. FERC’s December 18, 2025 order to PJM on co-located and behind-the-meter large loads requires PJM to propose a new megawatt threshold (stakeholder discussions have centered on roughly 20 MW) below which BTMG netting may continue, with a transition period for existing customers. This order is particularly relevant for SOFC-powered data centers because it determines whether the SOFC’s behind-the-meter output can be netted against the data center’s peak load for transmission-charge purposes — the core economic case for the architecture.
EPA permitting under Title V of the Clean Air Act, New Source Review, and Regional Haze Rule applies to on-site generation. SOFCs’ near-zero NOx emissions (Bloom’s 0.0017 lbs/MWh against Title V minor-source thresholds in the 1 lb/MWh range) generally place them below the threshold for major-source classification, easing the permitting burden compared to combustion turbines. Gas-fired backup generators have triggered EPA action at some Virginia data center campuses, with Loudoun County developers facing community challenges over diesel backup emissions. The EPA’s Energy Star Data Center program and Green Power Partnership provide voluntary frameworks recognizing on-site clean generation; participation has been growing but remains primarily a marketing rather than regulatory mechanism.
State net-metering rules and FERC’s PURPA-based qualifying facility rules govern whether a data center with on-site generation can sell power back to the grid. The Microsoft-co-designed Black Hills Energy “Large Power Contract Service” tariff in Wyoming (approved by the Wyoming Public Service Commission in 2016) serves loads above 13 MW with market-based energy and backup generation. We Energies’ March 2025 proposed “Very Large Customer” tariff before the Wisconsin Public Service Commission, backed by Microsoft, applies similar principles. Both function as templates for other states. The Ohio PUC’s settlement with AEP Ohio over 90% minimum demand charges sets a similar precedent in a 13-state RTO.
The DOE’s “Pathways to Commercial Liftoff” reports on advanced nuclear, clean hydrogen, and grid-scale storage explicitly call out demand aggregation from large power consumers as the mechanism for serial deployment. The NETL SOFC Program targets $225/kW stack and $900/kW system costs at over 60% efficiency without carbon capture. The Inflation Reduction Act’s Section 45V clean hydrogen production tax credit (up to $3/kg for low-carbon hydrogen) is the principal demand-side instrument for green hydrogen — and therefore for hydrogen-fueled SOFC operation.
The cleanest regulatory thesis that emerges from this fragmented picture: federal policy should not mandate a specific technology choice, but it should mandate that any AI data center development above a defined load threshold (the 100 MW used in the Trump July 2025 EO, or the 20 MW used in Washington’s HB 2515) come with a credible on-site generation plan that documents, at minimum, its primary generation source, its load-following capability, its emissions profile, its water use, its carbon-capture readiness, and its grid-integration mode (islanded, behind-the-meter, or export-eligible). This is the regulatory architecture that turns the loose collection of state bills and federal executive orders into a coherent demand signal for the SOFC, supercapacitor, and hybrid generation supply chains.
Section 7 — Grid Asset, Community Benefit, and the Social Contract
The final inversion in the AI infrastructure story is the move from data center as grid burden to data center as grid asset — and the regulatory architecture that would enable, encourage, or require it.
The model already exists in industrial-facility analogs. ERCOT’s Emergency Response Service (ERS) program enables industrial generators to bid demand-response capacity into the grid during emergency conditions; participants have included refineries, chemical plants, and aluminum smelters that can shed or shift load on the order of minutes. CAISO’s Demand Response Auction Mechanism and PJM’s Capacity Performance product have parallel structures. A data center with substantial on-site SOFC generation behaves, from the utility’s perspective, exactly like an industrial generator that can be brought to bear during peak emergencies — assuming the regulatory and market architecture allows it.
Microsoft’s broader sustainability commitments — to be carbon-negative by 2030, water-positive by 2030, zero-waste, and to protect more land than it uses — depend on solving the on-site power problem. Brad Smith, the company’s vice chair and president, wrote in late 2025 that Microsoft is “supporting a new rate structure that would charge ‘Very Large Customers,’ including datacenters, the cost of the electricity required to serve them. This protects residents by preventing those costs from being passed on. But we recognize the need to ensure that datacenter communities benefit everywhere. We believe this approach can and should be a model for other states.” The Three Mile Island restart, the 250 MW Portage County solar project supporting the new Wisconsin AI factory, the partnerships with Brookfield and Constellation, and the Project Forge / Project POLCA software stack are all subordinate to that primary policy ask: that data centers should pay for the power they require, and not socialize the costs onto residential ratepayers.
The business case for grid independence is equally clear. PJM transmission and distribution charges in the Mid-Atlantic have risen sharply with the 2026/27 capacity auction; data center load drove $9.3 billion of the 2025–2026 delivery year’s capacity bill. A 200-MW data center sited on the wrong side of an interconnection queue can wait three to eight years for grid service. Behind-the-meter SOFC deployment in 90 to 120 days, against a $720 billion grid investment requirement that Goldman Sachs Research estimates is needed through 2030, is a hedge against both time and cost. Boston Consulting Group’s 2025 report “Breaking Barriers to Data Center Growth” projects total global data center power demand of roughly 130 GW by 2028, with hyperscalers driving 60% of incremental demand growth; data center developers who can self-power that demand will be operating while their competitors are still in the queue.
The community-benefit case is more subtle and politically more important. Loudoun County, Virginia — the world’s densest concentration of data centers — has long defended its tax-revenue arguments against electricity-cost concerns. The Northern Virginia Technology Council’s 2023 study estimated 78,140 jobs and $31.4 billion in economic output from Virginia data centers; JLARC’s competing analysis found 74,000 jobs and $5.5 billion in labor income. The arithmetic that produced SB 253’s political consensus was simple: $1.6 billion in annual data-center tax exemptions against a $444-per-year residential bill increase by 2040 produced a bipartisan ratepayer-protection bill. According to a January 16, 2026 Global Strategy Group poll commissioned by CCAN Action Fund, 73% of Virginia likely voters now blame data centers for rising electricity costs, with nearly a third blaming them “a lot”; a Washington Post–Schar School poll the following April found voter comfort with a new data center in their community had plunged to 35%, down from 69% in 2023.
Failed power deals have produced project cancellations. Loudoun County’s 2024 moratorium on data centers in residential zones, Prince William County’s revisions to its 2023 PW Digital Gateway approval, Georgia’s growing utility resistance to data center connections, Indiana’s HB 1333 on local-tax reinvestment, and Ohio’s PUC requirements on minimum demand charges all reflect a political shift in which the social contract between data center developers and host communities is being renegotiated under load-growth pressure that the 2018 generation of incentive packages never anticipated.
The argument for on-site generation that can both serve the data center and feed back into the local grid is therefore as much social and political as it is technical. A 200-MW SOFC-powered data center that can deliver 30 MW of demand response to the local utility during peak emergencies; that produces no NOx or SOx; that generates rather than consumes water; that has carbon capture as a buildable add-on; and that did not require a single mile of new transmission line to be built — is the kind of facility communities can welcome. It is also the kind of facility that survives the political backlash now visible in 30 state legislatures.
That is the affirmative argument for a regulatory regime that requires on-site generation for new datacenter projects above a defined load threshold. The 100 MW threshold in the Trump July 2025 EO is too high; the 20 MW threshold in Washington’s HB 2515 is closer to right. The required disclosures should include primary generation source, load-following capability, emissions profile (especially NOx, SOx, particulate matter, and CO₂), water footprint, carbon-capture readiness, demand-response capability, and grid-integration mode (islanded, behind-the-meter, or export-eligible). The compliance options should include SOFCs, SOFC-GT hybrids, MCFC with carbon capture, advanced nuclear with grid-tied PPAs, biogas-fueled SOFCs, on-site solar with battery storage, and combinations thereof, with the operator free to choose the architecture that best fits the site. The certification regime should look like LEED or ENERGY STAR for the on-site generation portion of the facility — voluntary in detail, but practically required by community-benefit agreements, sustainability commitments, and utility tariff structures.
Such a regime would, finally, complete the inversion that the technology now permits. A data center is not the grid’s problem. With the right on-site generation architecture, a data center is the grid’s solution.
Recommendations
For federal policymakers (DOE, FERC, EPA, and Congress). First, restore the load-threshold disclosure requirement that EO 14141 implied but that the Trump July 2025 order stripped: any AI data center project above 100 MW seeking federal-lands access, FERC interconnection, or IRA tax-credit eligibility should be required to publish, at the design phase, its primary generation source, emissions profile (NOx, SOx, particulate, CO₂), water footprint, load-following architecture (including supercapacitor and battery storage), and carbon-capture readiness. Second, fund the NETL SOFC Program at the level needed to reach the $225/kW stack and $900/kW system targets by 2030, and explicitly extend the IRA 45V clean hydrogen credit guidance to clarify SOFC operation on green hydrogen. Third, complete the FERC December 2025 order’s directive to PJM on behind-the-meter generation netting at a 20 MW threshold rather than higher. Benchmark to change the recommendation: if 30 GW of new on-site SOFC, hybrid, or advanced-nuclear capacity is not under construction by January 2028, federal policy should move from incentives to mandates.
For state utility commissions (SCC, WUTC, CPUC, PUC of Ohio, ERCOT/PUCT, and equivalents). Adopt a “Very Large Customer” rate class for loads above 20 MW, modeled on the Black Hills Energy / Microsoft 2016 Wyoming tariff and We Energies’ March 2025 Wisconsin proposal. Require minimum demand charges of 80% to 90% on a 10- to 14-year contract structure, as Dominion’s September 2025 SCC filing proposed (85% transmission, 85% distribution, 60% generation) and as AEP Ohio’s PUC settlement contemplates. Pair the rate class with a streamlined permitting pathway for on-site generation projects that meet a defined emissions and water threshold (SOFCs would qualify trivially; advanced gas turbines might require additional carbon-capture commitments). Benchmark: if residential rate impacts from data center load exceed $10 per month in inflation-adjusted dollars over a three-year window, the rate class should be tightened further.
For data center developers (hyperscalers and colocation operators). Treat on-site SOFC, SOFC-GT, or SOFC + supercapacitor + battery architecture as the default for any new project above 100 MW. The Nebius-Bloom deal at 328 MW for $2.6 billion in service fees over three ten-year phases is the canonical price point — roughly $7,900 per kW of guaranteed capacity, against gas turbine lead times of three-plus years and PJM interconnection wait times of eight years. The Brookfield-Bloom $5 billion AI infrastructure partnership confirms the capital is available. Benchmark: if PJM interconnection times fall below 18 months and gas turbine lead times below 12 months by mid-2027, on-site SOFC may shift from default to optional; if those bottlenecks persist, on-site SOFC is the only credible path to scale.
For communities and ratepayer advocates. Demand transparency on the primary generation source serving any proposed data center above 20 MW. Support state bills modeled on Virginia’s SB 253/HB 1393, Washington’s HB 2515, and Maryland’s SB 596/HB 940. Push for community-benefit agreements that include demand-response capability, drought-condition water curtailment, and on-site generation export to the local distribution grid during emergencies. Benchmark: if a proposed data center cannot document the source of its primary power within 12 months of its initial siting application, the application should be denied.
For technology suppliers and investors. The investment thesis around SOFCs, hybrid SOFC-GTs, MCFC with carbon capture, and graphene-supercapacitor peak-shaving is now structural, not cyclical. Bloom Energy’s expansion from 1 GW to 2 GW of annual manufacturing capacity by end-2026, Skeleton Technologies’ opening of its €220 million Leipzig SuperFactory in November 2025 with U.S. expansion in Q1 2026, FuelCell Energy’s 360 MW data-center collaboration with Diversified Energy and TESIAC announced in March 2025, and the January 2026 SDCL–FuelCell Energy 450 MW global collaboration are leading indicators. The capital cycle here looks more like fiber-optic deployment in the late 1990s than like the 2010s renewable cycle. Benchmark: if SOFC stack costs do not fall to $225/kW by 2030 against the NETL target, the technology will compete on speed-to-power and emissions rather than on unit economics — still a credible market position, but a different one.
Caveats
Several claims in this essay come with important provisos. First, the Strubell et al. 626,155-pound CO₂e figure is for a Transformer-big model with neural architecture search — a specific experimental case — not for a single training run, which Strubell measured at 192 lb. The “five times the lifetime emissions of an average car” framing is widely cited but applies to NAS, not to baseline training. Second, the SOFC efficiency figures cited in this essay vary by configuration: 60% to 65% LHV for current Bloom Energy Server systems at beginning of life, declining to 53% at end of life; 65% to 73% for Mitsubishi MEGAMIE in pressurized SOFC-GT configurations with full heat recovery; and modeled efficiencies as high as 71.64% in MDPI-published integrated Rankine-cycle systems. The “70% electrical efficiency” claim for SOFC-GT hybrids is closer to a research projection or a combined-heat figure than to a deployed-unit electrical-only number; MHI’s MEGAMIE achieves “more than 65%” electric efficiency in commercial deployment. Third, Bloom Energy’s “net-positive water generation” claim is supported by the underlying chemistry (CH₄ + 2 O₂ → CO₂ + 2 H₂O) and by Bloom’s published “no water consumption during normal operation” specifications, but the net-positive framing assumes water capture and reuse rather than venting; Bloom’s own datasheets do not publish a system-level water-balance figure, and operators should verify the configuration at the deployment level. Fourth, the SOFC carbon-capture story is qualitatively well-established (nitrogen-free anode exhaust simplifies CO₂ separation) but at the system level it is supported by NETL and PNNL analyses (PNNL-SA-147003) and MDPI integrated-cycle studies rather than by a commercial Bloom-Energy carbon-capture deployment; the FuelCell Energy/ExxonMobil Rotterdam pilot is the closest current commercial demonstration, and that uses MCFC technology, not SOFC. Fifth, the Microsoft “800 MW reclaimed from idle servers” figure refers cumulatively to power harvested across Microsoft’s Azure fleet since 2019, not to a single deployment or year. Sixth, the Goldman Sachs Research forecast of 165% global data center power demand growth by 2030 is the stated published number from Schneider’s February 4, 2025 report; some commentators (notably The Kobeissi Letter via Benzinga) have referenced an updated 220% figure that has not been independently confirmed against Goldman’s primary publication. Seventh, Virginia SB 253 and HB 1393 had passed the General Assembly as of April 2026 and were subject to amendments and budget negotiations with Governor Spanberger as of May 2026; the final operative form of the law may differ. Eighth, the “~70% of U.S. transmission lines and transformers are 25+ years old” figure originates in a 2015 DOE infrastructure review and is widely re-cited but has not been comprehensively re-measured in a single more recent federal report; ASCE’s 2025 Report Card downgrade to D+ broadly corroborates the trajectory. Ninth, the Trump July 2025 “Accelerating Federal Permitting of Data Center Infrastructure” order does not carry the Executive Order 14318 numbering uniformly across legal commentary; we have referenced it by its operative title in this essay. Tenth and finally, the PJM eight-year interconnection wait time figure refers to projects that became operational in 2025; PJM’s reformed Cycle 1 targets one to two years going forward, but no project has yet completed the reformed cycle, so the eight-year figure is the most recent verifiable data point.